
The USD/CAD weekly forecast is slightly bearish as Canada’s employment report has increased bets of a BOC rate hike.
Ups and downs of USD/CAD
USD/CAD had a bullish week as the dollar soared. However, it ended the week well below its highs after Canada’s jobs report. The week started with data from the US, including the ISM non-manufacturing PMI and the initial jobless claims.
In August, the US services sector surprisingly picked up momentum. Additionally, last week, jobless claims reached their lowest point since February.
Meanwhile, the Canadian dollar gained strength against the US dollar on Friday. This happened because better-than-anticipated domestic jobs data increased the likelihood of Canada’s Central Bank raising interest rates.
Next week’s key events for USD/CAD
(Click on image to enlarge)
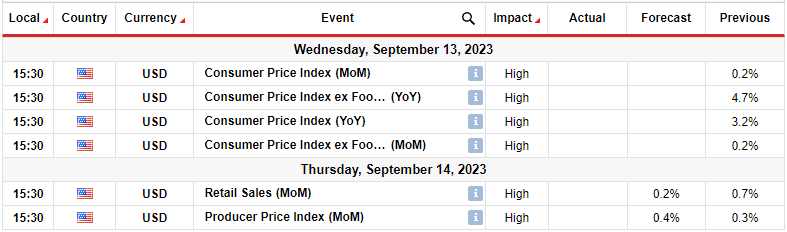
Investors will focus on data from the US next week as Canada will not release any essential data. The all-important consumer inflation report, retail sales, and producer prices report will come from the US. Investors are particularly eager to receive the US consumer inflation report as it will determine whether the Fed will hold high rates for long.
Meanwhile, the retail sales report will show the state of consumer spending in the US. Consumer spending plays a big part in driving the economy. Therefore, a higher reading could indicate a robust economy needing more work from the Fed.
Finally, the producer prices report is important as it will show inflation at the producer level.
USD/CAD weekly technical forecast: RSI signals weakness in a bullish trend.
(Click on image to enlarge)

USD/CAD daily chart
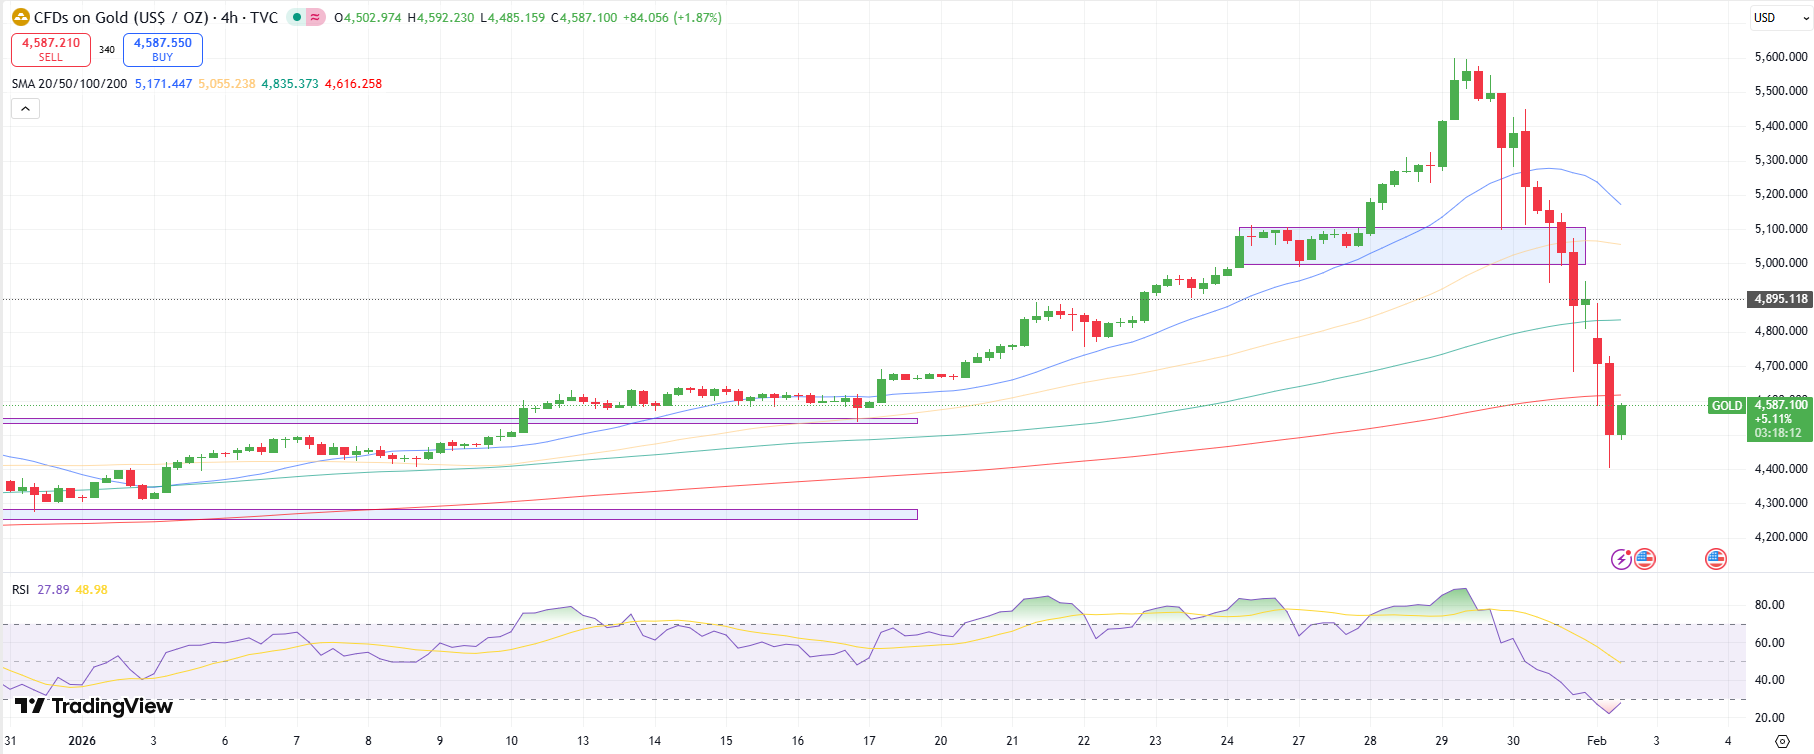
The bias for USD/CAD on the daily chart is bullish. After making a higher low at the 1.3501 key level, the price has made a higher high. Moreover, it has respected the 30-SMA as support, confirming the bullish bias.
Meanwhile, the RSI supports bullish momentum as it is nearly overbought. However, it has formed a slight bearish divergence with the price, which indicates some weakness in the bullish trend. Currently, the price has paused at the 1.3701 resistance level. Since the RSI shows that bulls have weakened, there might be a pullback or reversal from this level. A pullback would pause at the 30-SMA support, while a reversal would break below to retest the 1.3501 support.
More By This Author:
EUR/USD Price Analysis: Heading For Straight 8 Weeks Of LossesGBP/USD Outlook: Dollar’s Longest Weekly Rally In A Decade
Gold Price Struggling To Rebound After Upbeat Jobs Data

Comments
Log in or sign up to join the conversation.