
Photo by Michelle Spollen on Unsplash
USD/CAD looked in both directions on Friday as markets see thin action heading into the week’s closing bell. It was a relatively sedate trading week for the pair with the US Dollar (USD) gaining around a third of a percent against the Canadian Dollar (CAD).
Next week brings a slew of data for both the US and Canada with US Gross Domestic Product (GDP) on Wednesday and Canadian GDP on Thursday alongside US Personal Consumption Expenditure (PCE) figures. Next Friday also brings Purchasing Managers Index (PMI) figures for both Canada and the US.
Daily digest market movers: USD/CAD churns the midrange on quiet Friday
- Friday markets look thin, leaving USD/CAD open to drift in the middle.
- Thursday’s mixed PMIs for the US and Retail Sales for Canada leave the pair with little directional momentum to wrap up the week.
- Next week is set to open quiet as well with only January’s US New Home Sales on the docket for Monday.
- US New Home Sales Change last printed at 8.0% in December, New Home Sales are expected to increase slightly to 680K from 664K.
- Tuesday also sees mid-tier data with US Durable Goods figures for January forecast to print at -4.0% versus the previous 0.0%.
- Canada is absent from the economic calendar until Wednesday’s Current Account figures for the fourth quarter, which last printed at -3.22 billion.
Canadian Dollar price this week
The table below shows the percentage change of Canadian Dollar (CAD) against listed major currencies this week. Canadian Dollar was the strongest against the Japanese Yen.
| USD | EUR | GBP | CAD | AUD | JPY | NZD | CHF | |
| USD | -0.37% | -0.53% | 0.24% | -0.38% | 0.17% | -0.96% | 0.01% | |
| EUR | 0.35% | -0.18% | 0.59% | -0.02% | 0.52% | -0.60% | 0.38% | |
| GBP | 0.53% | 0.16% | 0.76% | 0.14% | 0.68% | -0.44% | 0.53% | |
| CAD | -0.23% | -0.59% | -0.74% | -0.60% | -0.06% | -1.19% | -0.21% | |
| AUD | 0.38% | 0.01% | -0.14% | 0.60% | 0.54% | -0.58% | 0.39% | |
| JPY | -0.17% | -0.55% | -0.69% | 0.06% | -0.57% | -1.14% | -0.17% | |
| NZD | 0.93% | 0.57% | 0.41% | 1.17% | 0.56% | 1.09% | 0.94% | |
| CHF | -0.02% | -0.39% | -0.55% | 0.21% | -0.39% | 0.15% | -0.96% |
The heat map shows percentage changes of major currencies against each other. The base currency is picked from the left column, while the quote currency is picked from the top row. For example, if you pick the Euro from the left column and move along the horizontal line to the Japanese Yen, the percentage change displayed in the box will represent EUR (base)/JPY (quote).
Technical analysis: 1.3500 is proving a tough number to beat
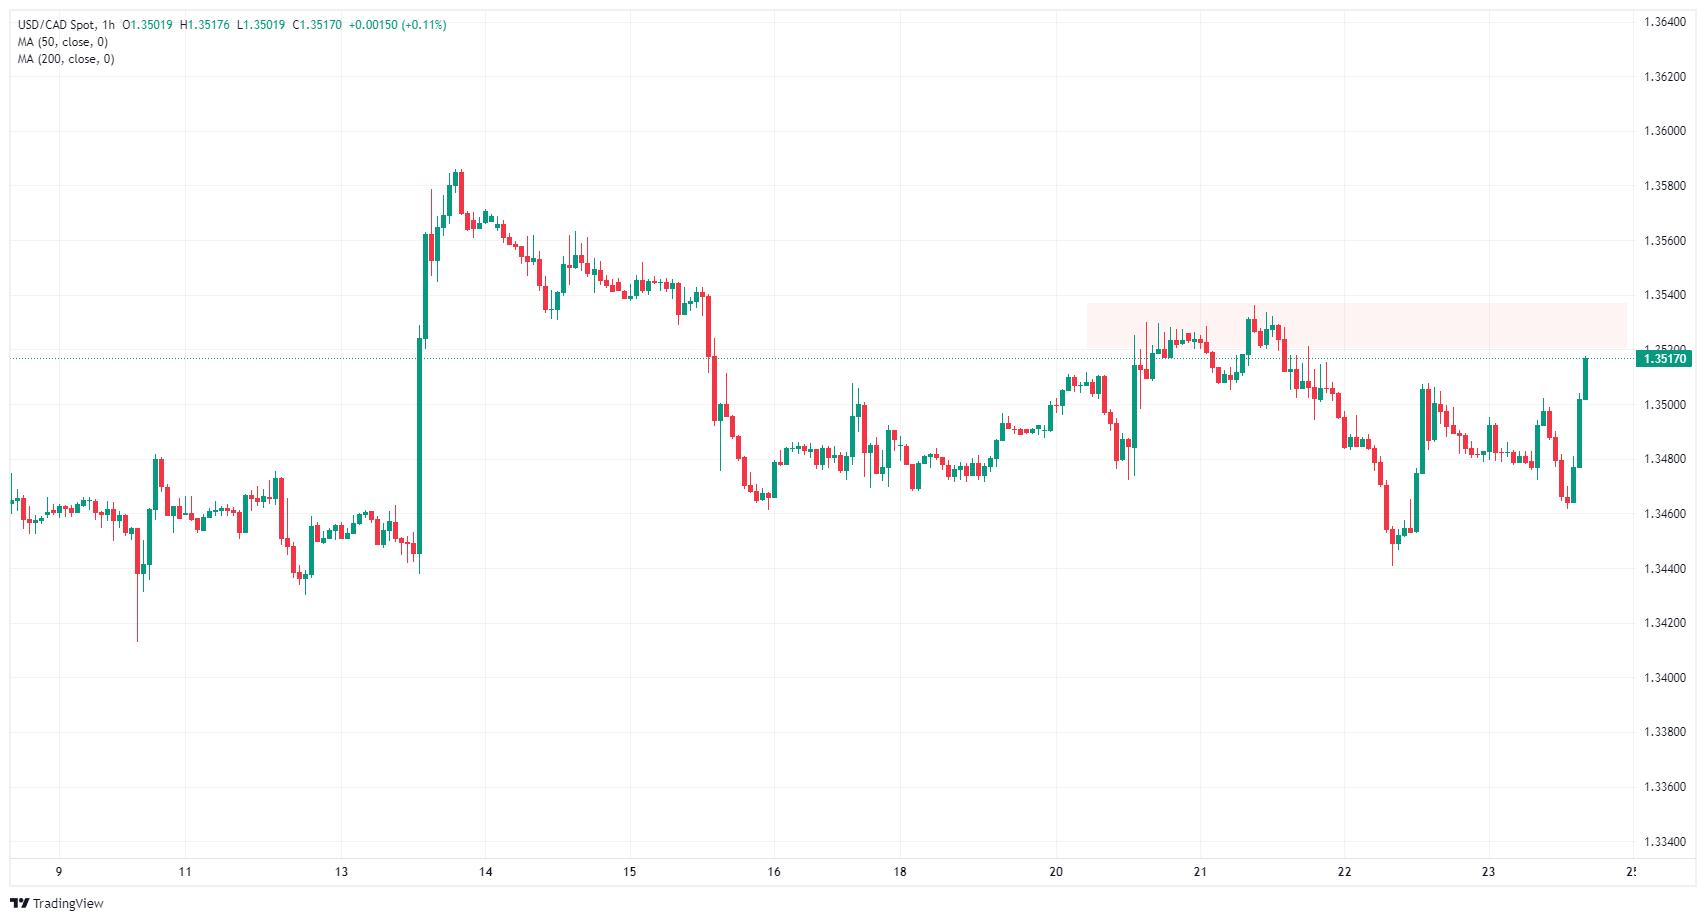
USD/CAD continues to cycle 1.3500 as the pair experiments with losing momentum in the longer term. The 1.3500 figure remains a sticky major level for the pair, but a heavy supply zone near 1.3530 could prove a viable selling region for particularly brave traders as the pair etches in the beginnings of a Fair Value Gap (FVG) on Friday.
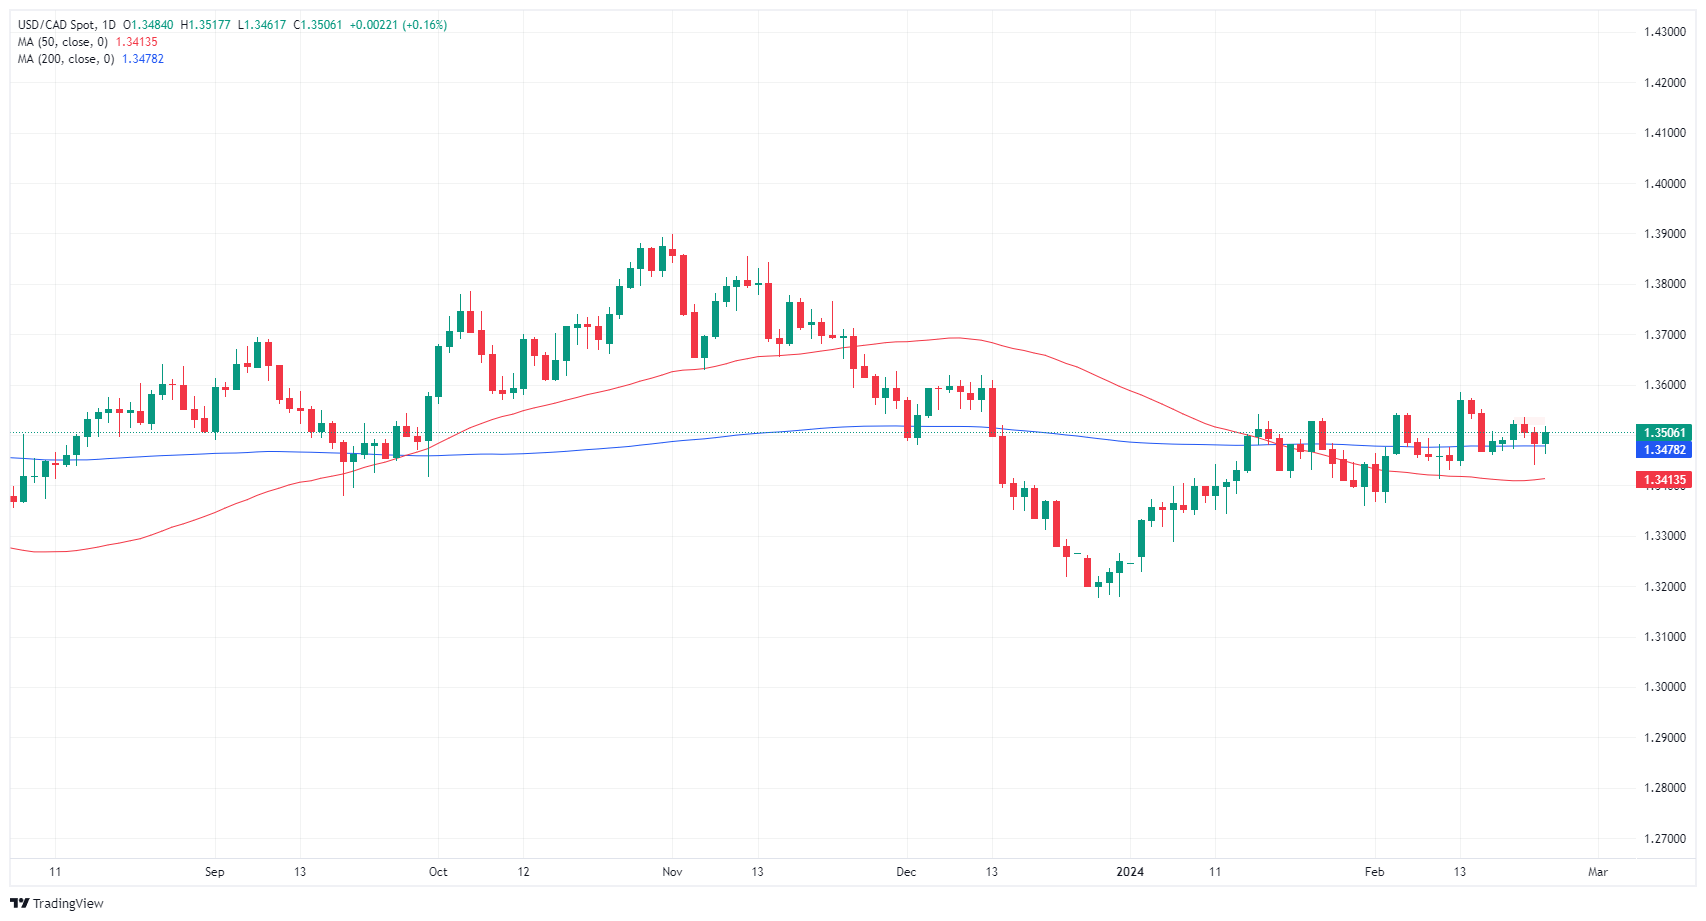
USD/CAD continues to get mired in the 200-day Simple Moving Average at 1.3478, but a rough bullish pattern is still bullish, and the long-term moving average is providing a technical floor for bidders to push off of.
USD/CAD hourly chart
(Click on image to enlarge)
USD/CAD daily chart
(Click on image to enlarge)
More By This Author:
USD/CAD Price Analysis: Remains Subdued Below 1.3500
EUR/JPY Extends Its Upside Above 163.00 Following German GDP Data
AUD/USD Aims Higher Amid Upbeat Mood, Mixed US Data


Comments
Log in or sign up to join the conversation.