
USD/CAD Rate Eyes September High As RSI Pushes Into Overbought Zone
USD/CAD trades near the weekly high (1.2837) following the kneejerk reaction to the ISM Manufacturing survey, and the exchange rate may continue to appreciate over the coming days as signs of a robust recovery puts pressure on the Federal Open Market Committee (FOMC) to implement a rate hike sooner rather than later.
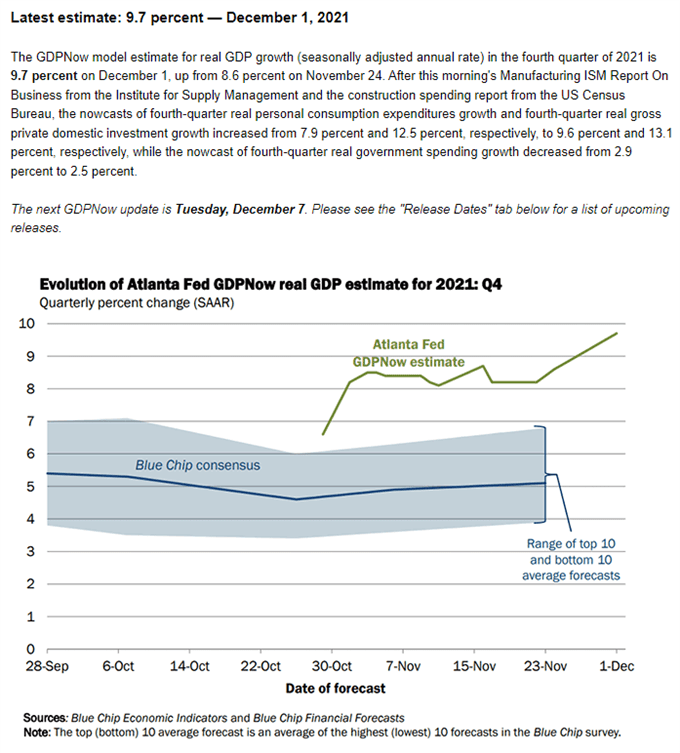
According to the Atlanta Fed, the “GDPNow model estimate for real GDP growth (seasonally adjusted annual rate) in the fourth quarter of 2021 is 9.7 percent on December 1, up from 8.6 percent on November 24,” and it remains to be seen if the FOMC will adjust its exit strategy for 2022 as Chairman Powell and Co. are slated to update the Summary of Economic Projections (SEP) at its next interest rate decision on December 15.
Until then, the Canadian Dollar may continue to underperform against its US counterpart as the Bank of Canada (BoC) insists that “the economy continues to require considerable monetary policy support” after concluding its quantitative easing (QE) program in October, but a further appreciation in USD/CAD may lead to a flip in retail sentiment like the behavior seen earlier this year.
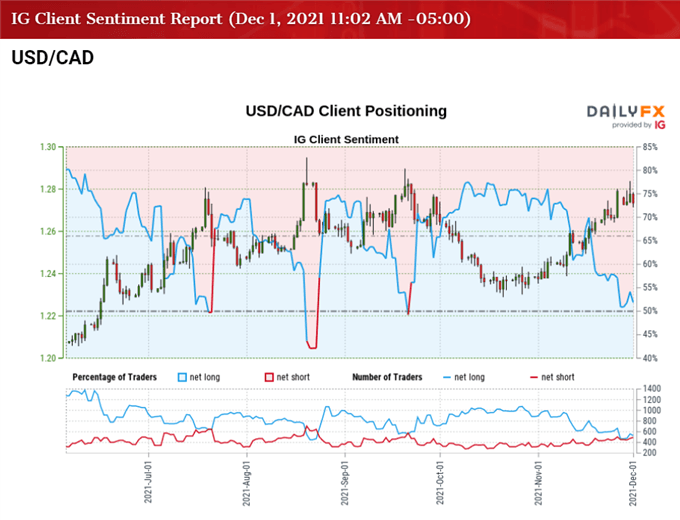
The IG Client Sentiment Report shows 53.90% of traders are currently net-long USD/CAD, with the ratio of traders long to short standing at 1.17 to 1.
The number of traders net-long is 10.38% higher than yesterday and 17.88% lower from last week, while the number of traders net-short is 4.84% lower than yesterday and 9.11% higher from last week. The decline in net-long position comes as USD/CAD trades near the weekly high (1.2837), while the rise in net-short interest has alleviated the crowding behavior seen since late-September as 63.80% of traders were net-long the pair last week.
With that said, USD/CAD may attempt to test the September high (1.2896) as the Relative Strength Index (RSI) pushes into overbought territory, and the bullish price action in the exchange rate is likely to persist as long as the oscillator holds above 70.
USD/CAD RATE DAILY CHART
(Click on image to enlarge)
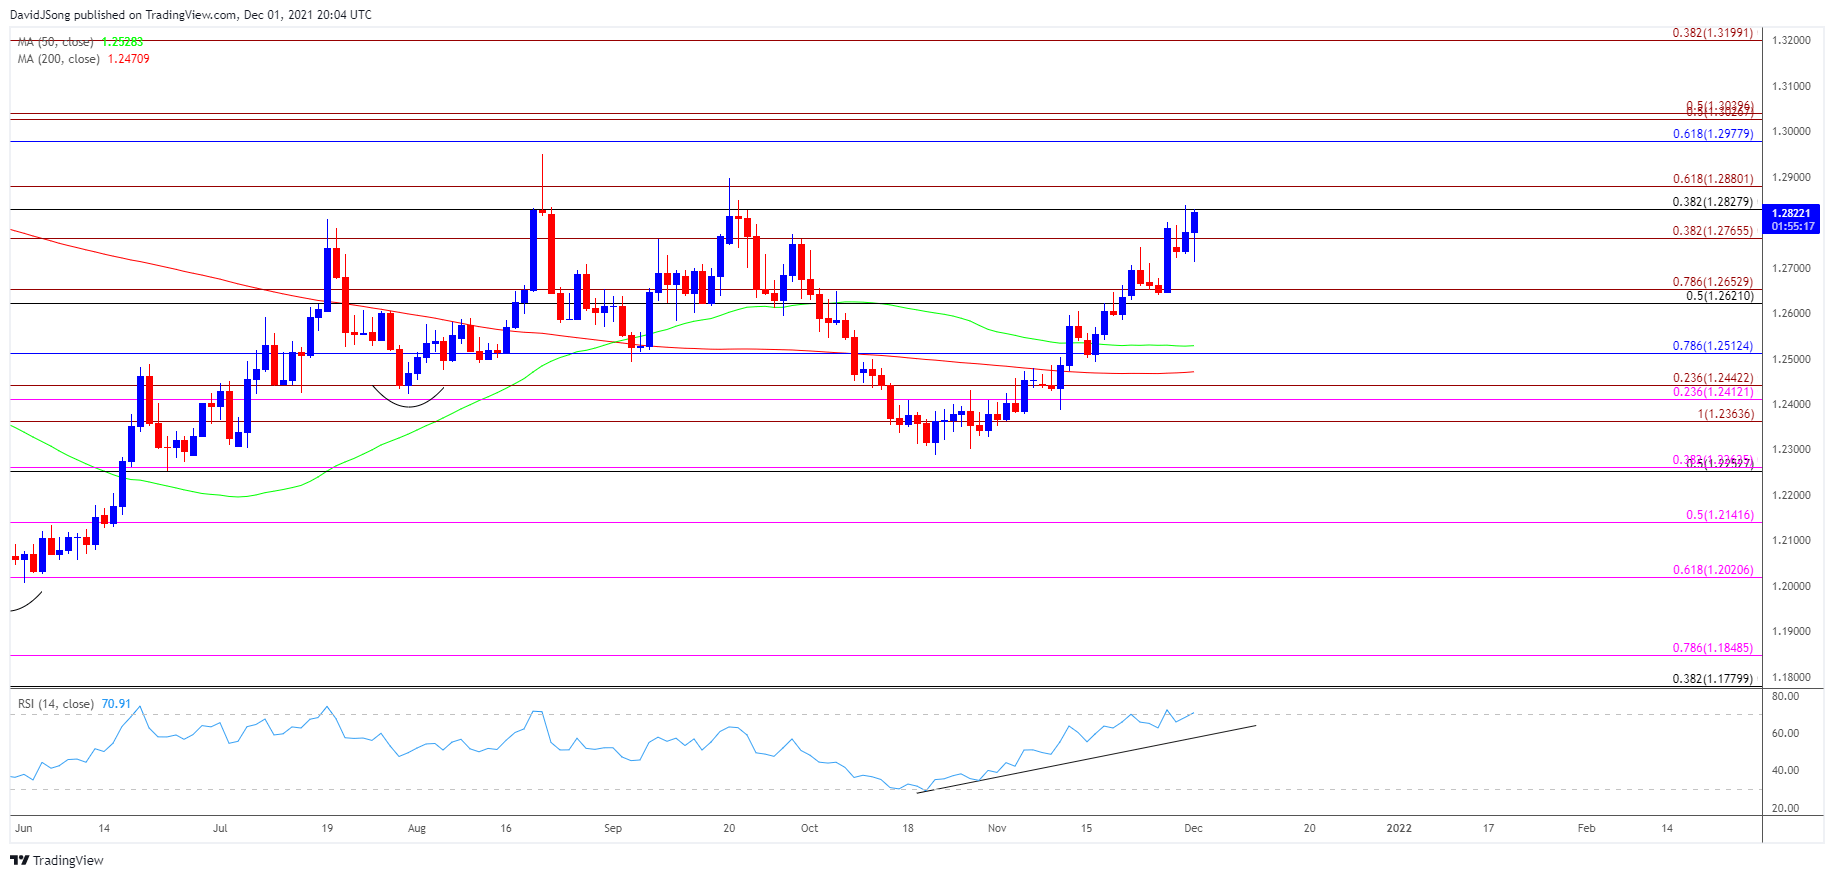
Source: Trading View
- Keep in mind, USD/CAD cleared the January high (1.2881) in August as an inverse head-and-shoulders formation took shape, but the exchange rate failed to defend the July low (1.2303) in October as the Relative Strength Index (RSI) dipped below 30.
- Nevertheless, the recovery from the October low (1.2288) has triggered an overbought readings in the RSI, and USD/CAD may attempt to test the September high (1.2896) as long as the oscillator holds above 70.
- Still need a close above the Fibonacci overlap around 1.2830 (38.2% retracement) to 1.2880 (61.8% expansion) to keep the topside levels on the radar, with a break above the August high (1.2949) opening up the 1.2980 (61.8% retracement) to 1.3040 (50% expansion) region.
Disclosure: See the full disclosure for DailyFX here.


