
The USD/CAD pair struggles to capitalize on Friday's bounce from the 1.3415-1.3410 area or a one-week low and oscillates in a narrow range through the early European session on the first day of a new week. Spot prices currently trade around the 1.3460 area, nearly unchanged for the day, and remain below the very important 200-day Simple Moving Average (SMA).
Crude Oil prices kick off the new week on a weaker note in the wake of easing concerns about supply from the Middle East, which is seen undermining the commodity-linked Loonie and acting as a tailwind for the USD/CAD pair. That said, Friday's upbeat domestic jobs report helps limit the downside for the Canadian Dollar (CAD), which, along with a modest US Dollar (USD) downtick keeps a lid on any meaningful appreciating move for the currency pair.
From a technical perspective, the recent failure ahead of mid-1.3600s, or a nearly two-month peak touched last week, constitutes the formation of multiple tops on the daily chart. That said, the lack of strong follow-through selling warrants some caution before positioning for any further losses. Moreover, oscillators on the daily chart – though have been losing traction – are yet to confirm a negative outlook and support prospects for the emergence of some dip-buying.
Hence, Friday's swing low, around the 1.3415-1.3410 area, might continue to protect the immediate downside ahead of the 1.3400 mark. The next relevant support is pegged near the 1.3345 region, or the YTD trough, which if broken decisively will be seen as a fresh trigger for bearish traders. The USD/CAD pair might then accelerate the downward trajectory further towards the 1.3300 mark before dropping to mid-1.3200s and sub-1.3200 levels, or the December swing low.
On the flip side, momentum beyond the 1.3475 area (200-day SMA) is likely to confront resistance near the 1.3500 psychological mark ahead of the 1.3540-1.3545 region, or the multiple-tops. A sustained strength beyond the latter will negate any near-term negative outlook and pave the way for some meaningful appreciating move. The USD/CAD pair might then accelerate the positive move towards the 1.3600 round figure and the 1.3610-1.3615 supply zone.
USD/CAD daily chart
(Click on image to enlarge)
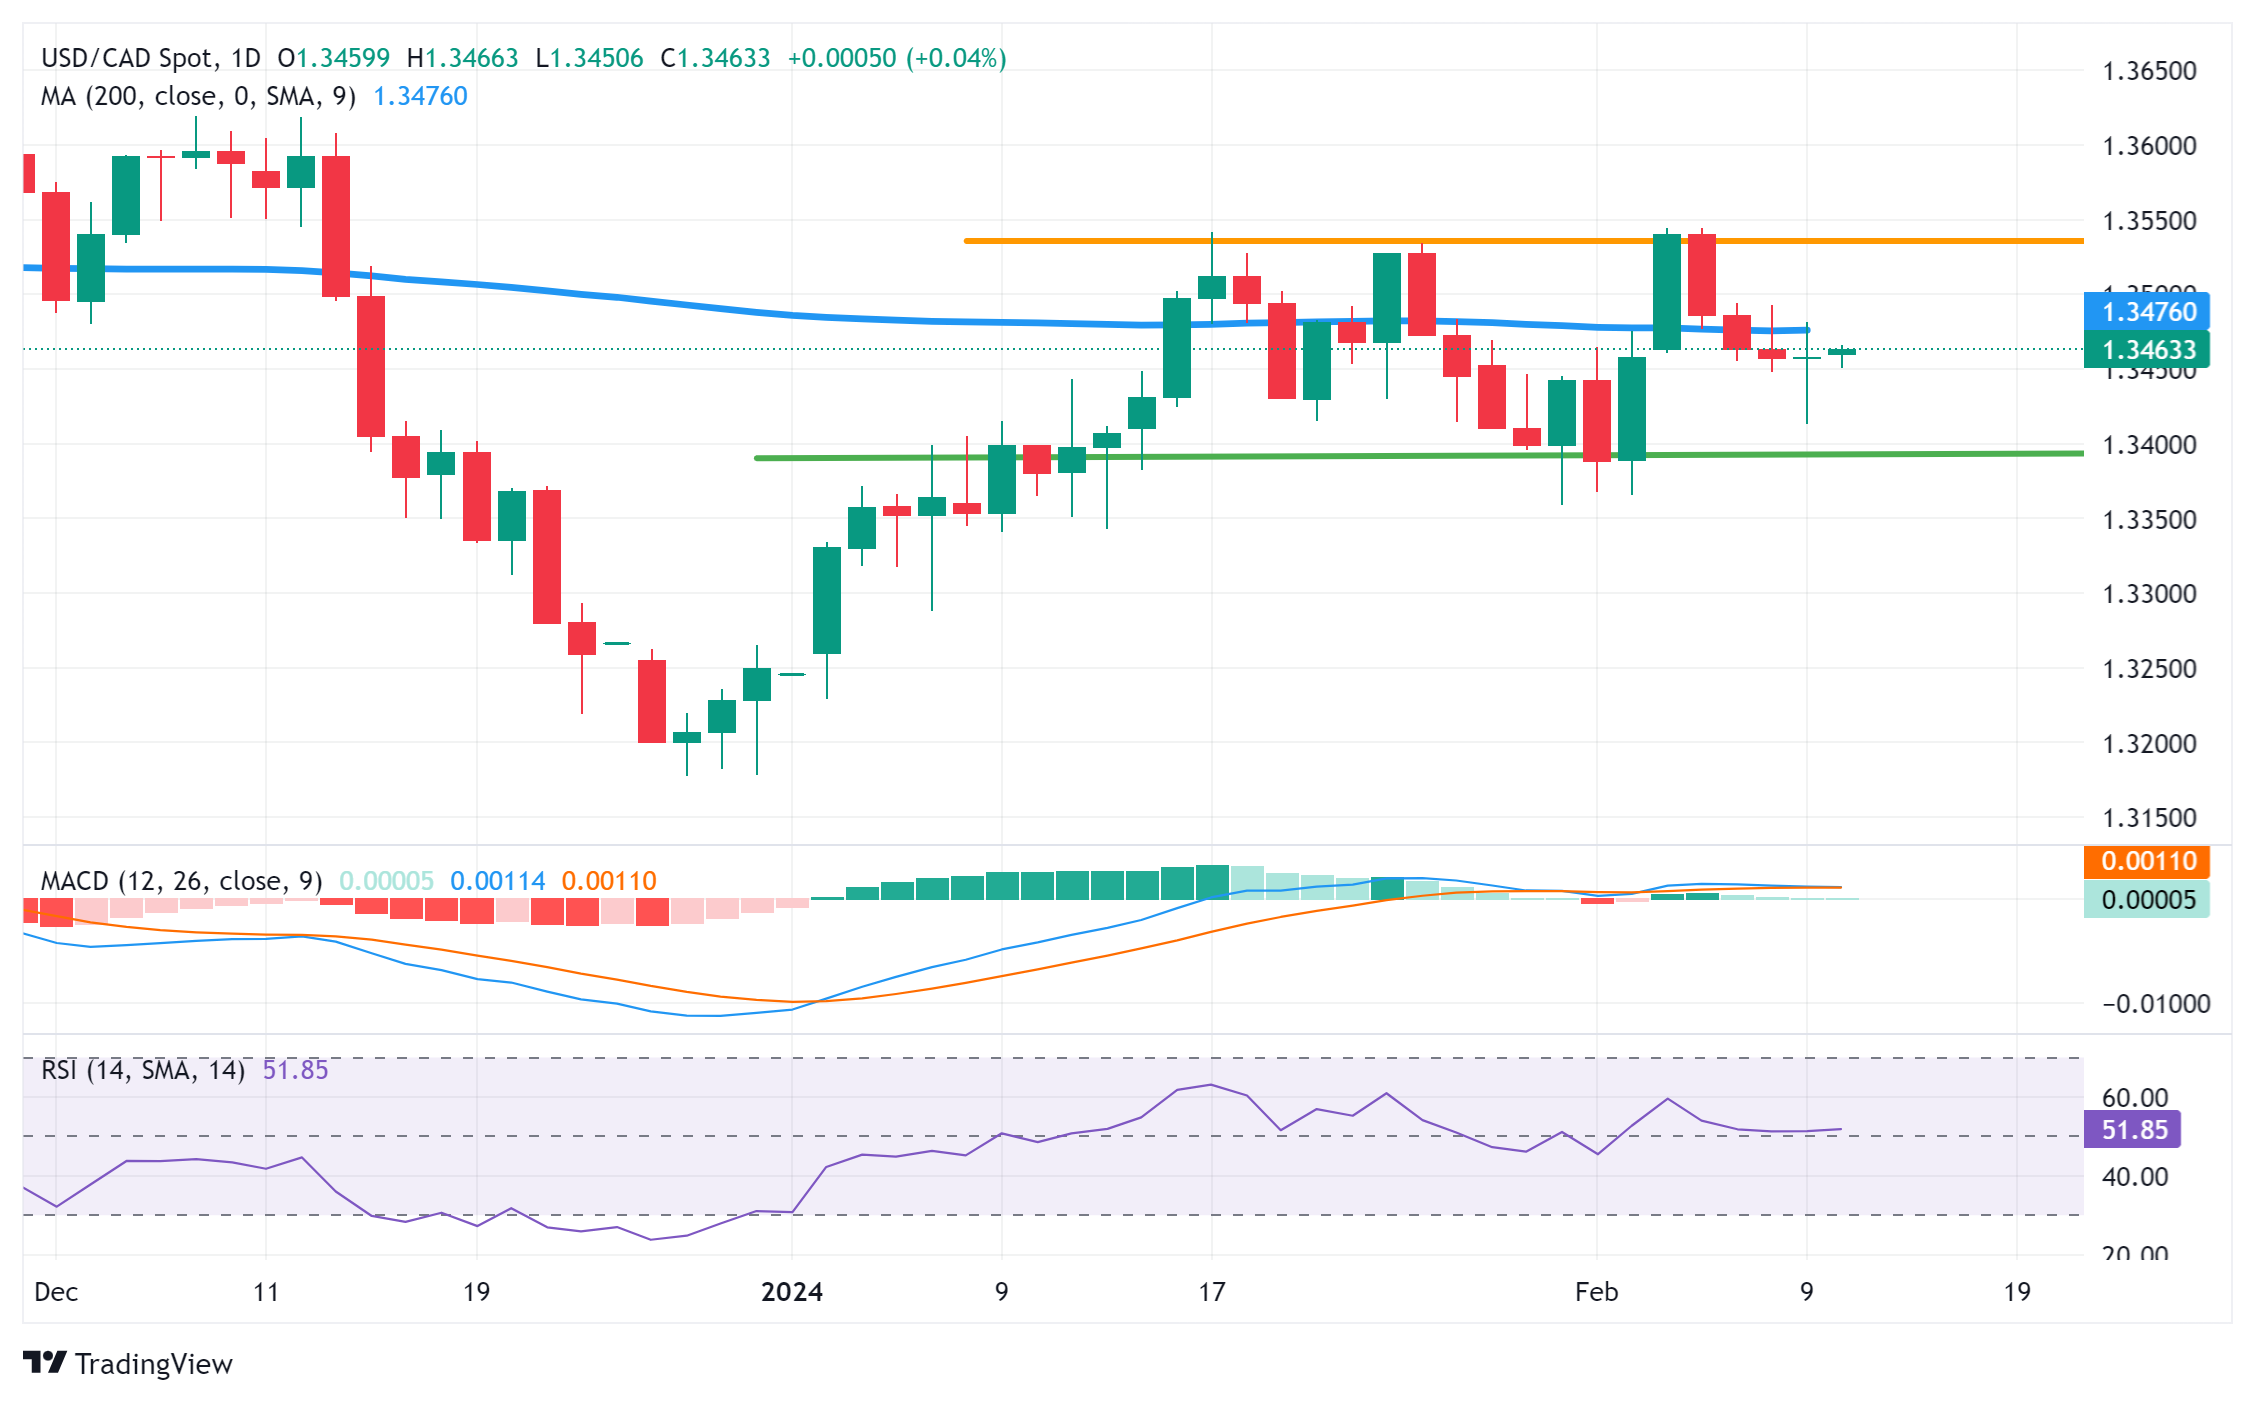
Technical levels to watch
USD/CAD
| OVERVIEW | |
|---|---|
| Today last price | 1.3467 |
| Today Daily Change | 0.0009 |
| Today Daily Change % | 0.07 |
| Today daily open | 1.3458 |
| TRENDS | |
|---|---|
| Daily SMA20 | 1.3463 |
| Daily SMA50 | 1.342 |
| Daily SMA100 | 1.3553 |
| Daily SMA200 | 1.3476 |
| LEVELS | |
|---|---|
| Previous Daily High | 1.3482 |
| Previous Daily Low | 1.3413 |
| Previous Weekly High | 1.3544 |
| Previous Weekly Low | 1.3413 |
| Previous Monthly High | 1.3542 |
| Previous Monthly Low | 1.3229 |
| Daily Fibonacci 38.2% | 1.3455 |
| Daily Fibonacci 61.8% | 1.3439 |
| Daily Pivot Point S1 | 1.342 |
| Daily Pivot Point S2 | 1.3382 |
| Daily Pivot Point S3 | 1.3352 |
| Daily Pivot Point R1 | 1.3489 |
| Daily Pivot Point R2 | 1.352 |
| Daily Pivot Point R3 | 1.3558 |
More By This Author:
GBP/JPY Remains Tipped Into Bullish Side At The Tail End Of Another Tepid WeekEUR/USD Finds Thin Gains On Friday, Remains Capped Below 1.0800
AUD/JPY Bulls Gain Ground As RBA And BOJ Monetary Policies Diverge


Comments
Log in or sign up to join the conversation.