
The USD/CAD pair oscillates in a tight range around 1.3450 as investors await the Canadian Employment data for January, which will be published at 13:30 GMT.
Investors anticipate Canadian employers recruiting 15K new workers against flat demand in December. The Unemployment Rate is expected to increase slightly to 5.9% vs. the prior reading of 5.8%. The Bank of Canada (BoC) may focus on keeping interest rates at their current level longer if the labor market conditions remain upbeat.
Meanwhile, the US Dollar Index (DXY) attempts to recover as market mood remains cautious due to deepening Middle East tensions. Israel denies the ceasefire proposal from Hamas having unacceptable terms. Also, investors await January's United States inflation data, which will be published on Tuesday. Investors see price pressures expanding at a steady pace.
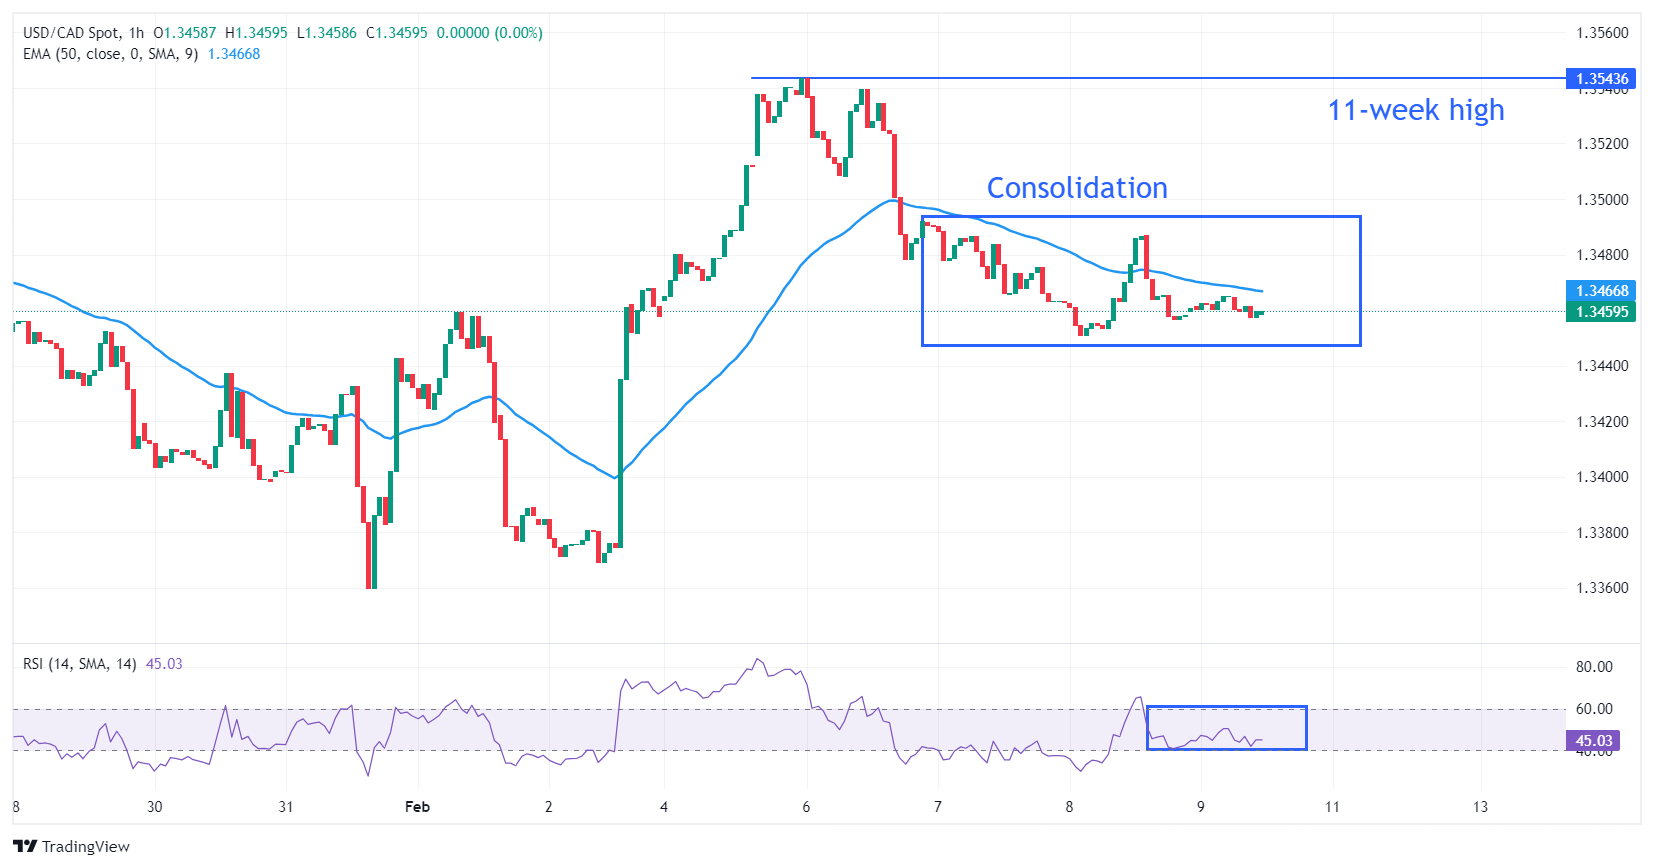
USD/CAD turns sideways in a range of 1.3450-1.3500 after correction from an 11-week high of 1.3544 on an hourly scale. The Loonie asset struggles for a direction ahead of crucial labor market data. The 50-period Exponential Moving Average (EMA) around 1.3460 has overlapped the Loonie asset, indicating a sharp contraction in volatility.
The 14-period Relative Strength Index (RSI) oscillates in the 40.00-60.00 range, indicating a sideways trend.
The fresh upside would emerge if the Loonie asset climbed above the January 17 high at 1.3542, which will drive the asset towards the round-level resistance of 1.3600, followed by the November 30 high at 1.3627.
On the flip side, a sell-off could appear if the Loonie asset drops below January 31 low at 1.3359. This will expose the asset to January 4 low at 1.3318 and January 5 low at 1.3288.
USD/CAD hourly chart
(Click on image to enlarge)
USD/CAD
| OVERVIEW | |
|---|---|
| Today last price | 1.346 |
| Today Daily Change | 0.0002 |
| Today Daily Change % | 0.01 |
| Today daily open | 1.3458 |
| TRENDS | |
|---|---|
| Daily SMA20 | 1.3461 |
| Daily SMA50 | 1.3421 |
| Daily SMA100 | 1.3553 |
| Daily SMA200 | 1.3476 |
| LEVELS | |
|---|---|
| Previous Daily High | 1.3493 |
| Previous Daily Low | 1.3448 |
| Previous Weekly High | 1.3476 |
| Previous Weekly Low | 1.3359 |
| Previous Monthly High | 1.3542 |
| Previous Monthly Low | 1.3229 |
| Daily Fibonacci 38.2% | 1.3465 |
| Daily Fibonacci 61.8% | 1.3476 |
| Daily Pivot Point S1 | 1.3439 |
| Daily Pivot Point S2 | 1.3421 |
| Daily Pivot Point S3 | 1.3394 |
| Daily Pivot Point R1 | 1.3485 |
| Daily Pivot Point R2 | 1.3512 |
| Daily Pivot Point R3 | 1.353 |
More By This Author:
WTI Consolidates Near Weekly Top, Just Below Mid-$76.00s Amid Middle East TensionsEUR/USD Snaps Three-day Winning Streak, Downside Seems Limited Ahead Of Next Week's US CPI
EUR/JPY Remains Capped Below 161.00 Following German CPI Data


Comments
Log in or sign up to join the conversation.