
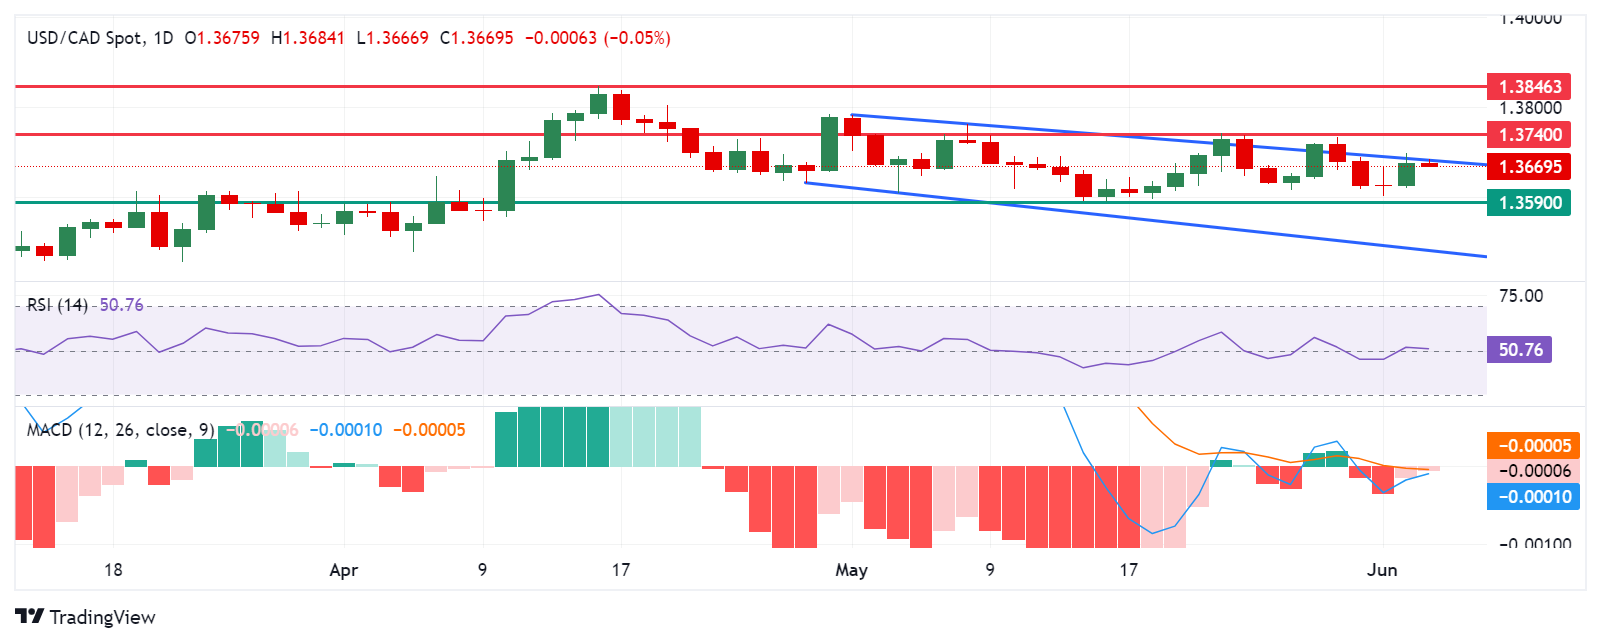
USD/CAD treads water to continue its gains for the second consecutive session, trading around 1.3680 during the European hours on Wednesday. Analysis of the daily chart suggests a bearish bias for the USD/CAD pair, as it remains within a descending channel. However, the 14-day Relative Strength Index (RSI) has slightly moved above the 50 level, and further upward movement may indicate a weakening of this bearish bias.
The Moving Average Convergence Divergence (MACD) indicator suggests a potential momentum shift for the USD/CAD pair. While the MACD line is positioned below the centerline, it shows convergence below the signal line. A break above the centerline could further weaken the bearish trend.
The USD/CAD pair could find key support around the psychological level of 1.3600 and the throwback support at 1.3590. A break below the latter could exert downward pressure on the pair, leading it to test the psychological level of 1.3500, followed by the lower threshold of the descending channel.
On the upside, the USD/CAD pair could break above the upper boundary of the descending channel, followed by a psychological level of 1.3700 and a pullback resistance of 1.3740. A breakthrough above this resistance could lead the pair to explore the region around the key level of 1.3800, followed by April’s high of 1.3846.
USD/CAD: Daily Chart
(Click on image to enlarge)
USD/CAD
| OVERVIEW | |
|---|---|
| Today last price | 1.3683 |
| Today Daily Change | 0.0007 |
| Today Daily Change % | 0.05 |
| Today daily open | 1.3676 |
| TRENDS | |
|---|---|
| Daily SMA20 | 1.366 |
| Daily SMA50 | 1.3663 |
| Daily SMA100 | 1.3583 |
| Daily SMA200 | 1.3576 |
| LEVELS | |
|---|---|
| Previous Daily High | 1.3699 |
| Previous Daily Low | 1.3621 |
| Previous Weekly High | 1.3735 |
| Previous Weekly Low | 1.3615 |
| Previous Monthly High | 1.3783 |
| Previous Monthly Low | 1.359 |
| Daily Fibonacci 38.2% | 1.3669 |
| Daily Fibonacci 61.8% | 1.3651 |
| Daily Pivot Point S1 | 1.3631 |
| Daily Pivot Point S2 | 1.3587 |
| Daily Pivot Point S3 | 1.3553 |
| Daily Pivot Point R1 | 1.371 |
| Daily Pivot Point R2 | 1.3744 |
| Daily Pivot Point R3 | 1.3788 |
More By This Author:
WTI Drops To Near $73.00 Due To Builds In US Oil StockpilesUSD/CAD Price Analysis: Rises Toward 1.3700 Despite A Bearish Bias
Japanese Yen Depreciates As Global Bond Yields Reduce Safe-Haven Demand


Comments
Log in or sign up to join the conversation.