
USD/CAD hovers near 1.3330 during the Asian session on Wednesday. The USD/CAD pair receives upward support as investors turn back to the US Dollar (USD) on risk-off sentiment.
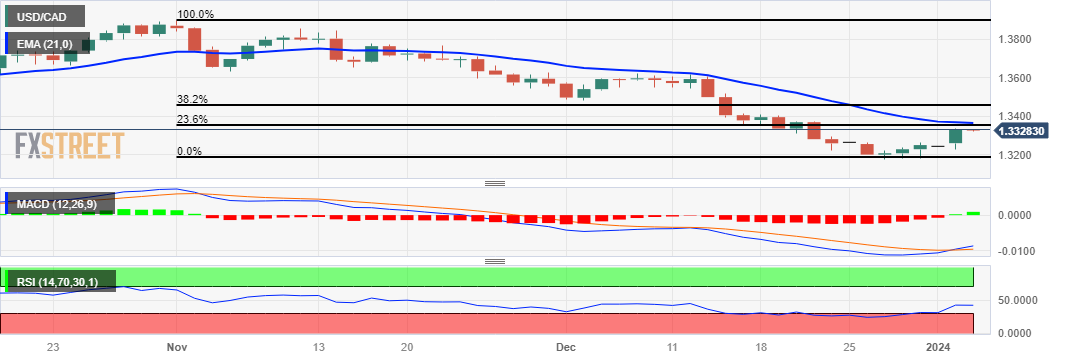
The technical analysis of the Moving Average Convergence Divergence (MACD) for the USD/CAD pair suggests a potential shift in the pair's trend as the MACD line lies below the centreline but shows divergence above the signal line.
However, the lagging indicator 14-day Relative Strength Index (RSI) is positioned below 50. Traders will likely wait for confirmation implying that the USD/CAD pair could change its direction.
The USD/CAD pair could find key support near the psychological level at 1.3300 following the major support at 1.3250 level. A break below the latter could push the pair to navigate the region around the weekly low at 1.3228 followed by the psychological level at 1.3200.
The analysis suggests that on the upside, the major level at 1.3350 aligned with the 23.6% Fibonacci retracement level at 1.3351 could act as a key resistance zone. A breakthrough above the key resistance zone could lead the USD/CAD pair to surpass the 21-day Exponential Moving Average (EMA) at 1.3363 following the psychological barrier at 1.3400.
If the USD/CAD pair manages to pass through the psychological resistance, it may explore further upward movement toward the 38.2% Fibonacci retracement level at 1.3456.
USD/CAD: Daily Chart
(Click on image to enlarge)
USD/CAD: MORE TECHNICAL LEVELS
| OVERVIEW | |
|---|---|
| Today last price | 1.3326 |
| Today Daily Change | -0.0005 |
| Today Daily Change % | -0.04 |
| Today daily open | 1.3331 |
| TRENDS | |
|---|---|
| Daily SMA20 | 1.3379 |
| Daily SMA50 | 1.358 |
| Daily SMA100 | 1.3585 |
| Daily SMA200 | 1.3485 |
| LEVELS | |
|---|---|
| Previous Daily High | 1.3334 |
| Previous Daily Low | 1.3229 |
| Previous Weekly High | 1.3267 |
| Previous Weekly Low | 1.3178 |
| Previous Monthly High | 1.362 |
| Previous Monthly Low | 1.3178 |
| Daily Fibonacci 38.2% | 1.3294 |
| Daily Fibonacci 61.8% | 1.3269 |
| Daily Pivot Point S1 | 1.3262 |
| Daily Pivot Point S2 | 1.3193 |
| Daily Pivot Point S3 | 1.3157 |
| Daily Pivot Point R1 | 1.3367 |
| Daily Pivot Point R2 | 1.3403 |
| Daily Pivot Point R3 | 1.3472 |
More By This Author:
Silver Price Analysis: Silver Hits Multi-Week Low, Seems Vulnerable Below 50% Fibo.GBP/USD Trades Higher Near 1.2630 Amid Weaker UK Business Confidence, US Data Eyed
S&P 500 Kicks Off 2024 With A Bearish Tone On Tuesday, Slips Back Towards $4,700


Comments
Log in or sign up to join the conversation.