
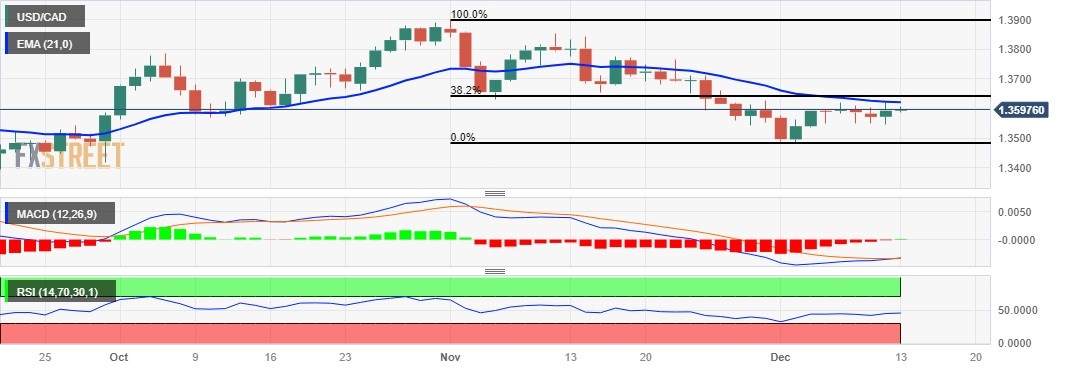
USD/CAD struggles to extend its gains for the second successive day while US Dollar (USD) stays in the positive territory. The downbeat Crude oil prices reinforce the downward pressure on the Canadian Dollar (CAD). The USD/CAD pair trades higher around 1.3590 during the European session on Wednesday.
The USD/CAD pair finds the psychological level at 1.3600 as a key barrier. A firm break above the latter could inspire the bulls of the USD/CAD pair to explore the 21-day Exponential Moving Average (EMA) at 1.3620 followed by the 38.2% Fibonacci retracement level at 1.3840 before the major resistance at 1.3650 level.
The technical indicator Moving Average Convergence Divergence (MACD) for the USD/CAD pair signals a potential bullish trend reversal. MACD line lies below the centerline and crosses above the signal line. The crossover above the signal line suggests that the shorter-term moving average is gaining strength relative to the longer-term moving average, indicating a shift towards positive momentum in the pair.
However, the analysis suggests a dovish sentiment for the USD/CAD pair, with the 14-day Relative Strength Index (RSI) below 50. This implies a weakness in the pair, and it could lose ground. The mentioned support levels, including the major level around 1.3550 and the psychological support at 1.3500, are crucial markers to watch.
If the USD/CAD pair breaks below the latter, it might encounter further bearish pressure, potentially navigating toward the region around the previous week's low at 1.3480.
USD/CAD: Daily Chart
(Click on image to enlarge)
USD/CAD: MORE TECHNICAL LEVELS
| OVERVIEW | |
|---|---|
| Today last price | 1.3592 |
| Today Daily Change | 0.0000 |
| Today Daily Change % | 0.00 |
| Today daily open | 1.3592 |
| TRENDS | |
|---|---|
| Daily SMA20 | 1.3626 |
| Daily SMA50 | 1.3688 |
| Daily SMA100 | 1.3591 |
| Daily SMA200 | 1.3516 |
| LEVELS | |
|---|---|
| Previous Daily High | 1.3619 |
| Previous Daily Low | 1.3545 |
| Previous Weekly High | 1.362 |
| Previous Weekly Low | 1.348 |
| Previous Monthly High | 1.3899 |
| Previous Monthly Low | 1.3541 |
| Daily Fibonacci 38.2% | 1.3591 |
| Daily Fibonacci 61.8% | 1.3573 |
| Daily Pivot Point S1 | 1.3552 |
| Daily Pivot Point S2 | 1.3512 |
| Daily Pivot Point S3 | 1.3479 |
| Daily Pivot Point R1 | 1.3626 |
| Daily Pivot Point R2 | 1.3659 |
| Daily Pivot Point R3 | 1.3699 |
More By This Author:
USD/CHF Rebounds Near 0.8760 As US Dollar Improves Before Fed DecisionEUR/USD Price Analysis: Retraces Recent Gains Ahead Of Fed Decision, Hovers Below 1.0800
GBP/USD Hovers Above 1.2550 Ahead Of UK GDP, Fed Policy Decision


Comments
Log in or sign up to join the conversation.