
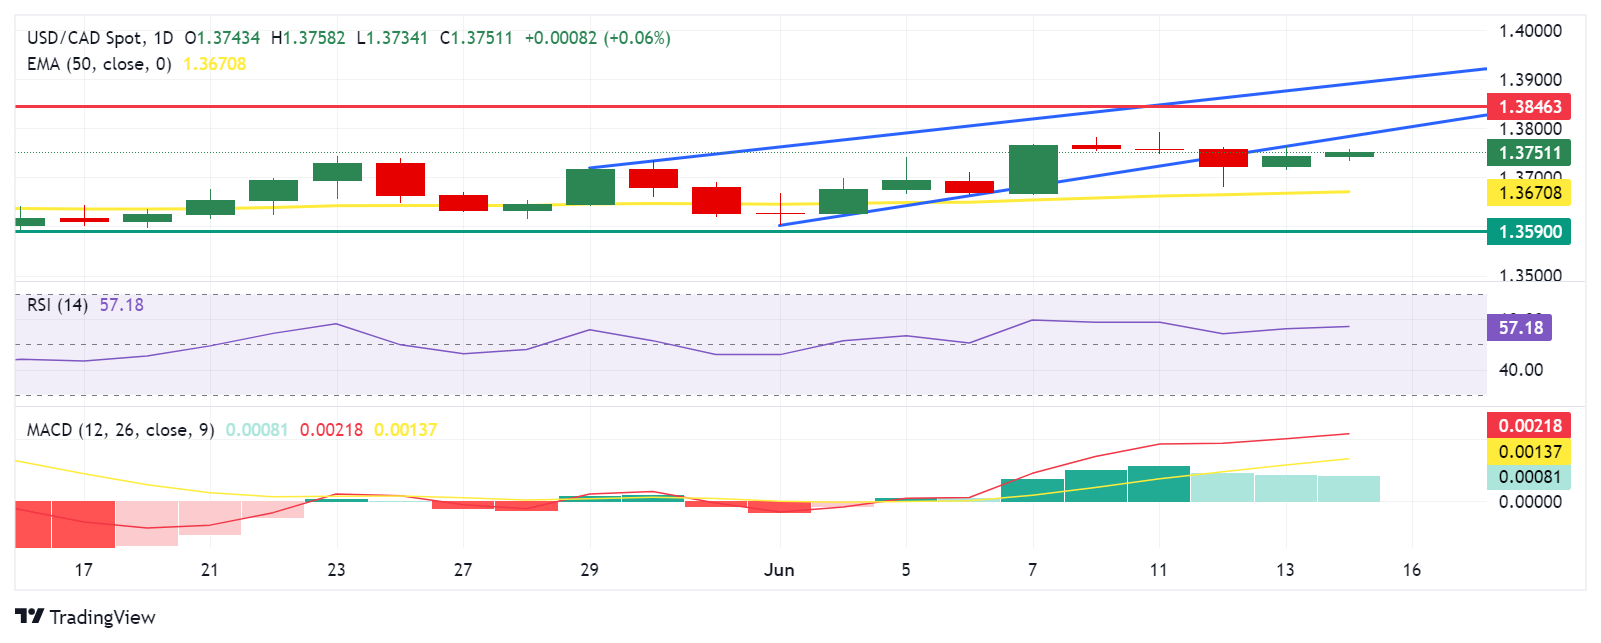
USD/CAD extends its gains for the second day, trading around 1.3750 during early European hours on Friday. Analysis of the daily chart indicates a weakening bullish bias for the USD/CAD pair, as it struggles to re-enter the rising channel pattern. Despite this, the 14-day Relative Strength Index (RSI) remains above the 50 level, suggesting that the bullish momentum is not entirely lost. Further price movements will be needed to provide a clearer directional indication.
Additionally, the momentum indicator Moving Average Convergence Divergence (MACD) suggests an upward trend for the USD/CAD pair, as the MACD line is positioned above the centerline and shows divergence above the signal line. This indicates that the bullish momentum may continue and support the pair to return to the rising channel pattern.
The USD/CAD pair may test the lower boundary of the rising channel around 1.3780, followed by the key barrier at the psychological level of 1.3800. Further support is found at April’s high of 1.3846. A break above this level could lead the USD/CAD pair to approach the upper threshold of the rising channel around 1.3890.
On the downside, the USD/CAD pair could find immediate support at the psychological level of 1.3700, which aligns with the 50-day Exponential Moving Average (EMA) at 1.3670. A break below this level could exert pressure on the pair, pushing it toward the throwback support region around 1.3590.
USD/CAD: Daily Chart
(Click on image to enlarge)
USD/CAD
| OVERVIEW | |
|---|---|
| Today last price | 1.3753 |
| Today Daily Change | 0.0010 |
| Today Daily Change % | 0.07 |
| Today daily open | 1.3743 |
| TRENDS | |
|---|---|
| Daily SMA20 | 1.3685 |
| Daily SMA50 | 1.3689 |
| Daily SMA100 | 1.3601 |
| Daily SMA200 | 1.358 |
| LEVELS | |
|---|---|
| Previous Daily High | 1.3764 |
| Previous Daily Low | 1.3715 |
| Previous Weekly High | 1.3768 |
| Previous Weekly Low | 1.3603 |
| Previous Monthly High | 1.3783 |
| Previous Monthly Low | 1.359 |
| Daily Fibonacci 38.2% | 1.3745 |
| Daily Fibonacci 61.8% | 1.3734 |
| Daily Pivot Point S1 | 1.3717 |
| Daily Pivot Point S2 | 1.3692 |
| Daily Pivot Point S3 | 1.3669 |
| Daily Pivot Point R1 | 1.3766 |
| Daily Pivot Point R2 | 1.3789 |
| Daily Pivot Point R3 | 1.3815 |
More By This Author:
WTI Stays Timid Around $78.00 Ahead Of US PPI
USD/CAD Price Analysis: Rises To Near 1.3750 Nearing Lower Boundary Of Rising Channel
USD/CHF Remains Timid Around 0.8950 Due To Investors’ Caution Ahead Of FOMC Decision


Comments
Log in or sign up to join the conversation.