
USD/CAD extends its losses for the second successive day, trading lower around 1.3530 during the European session on Friday. The weakened US Dollar (USD) exerts pressure and undermines the pair. Furthermore, the rebound in WTI prices could provide support to the Canadian Dollar (CAD), consequently putting downward pressure on the USD/CAD pair.
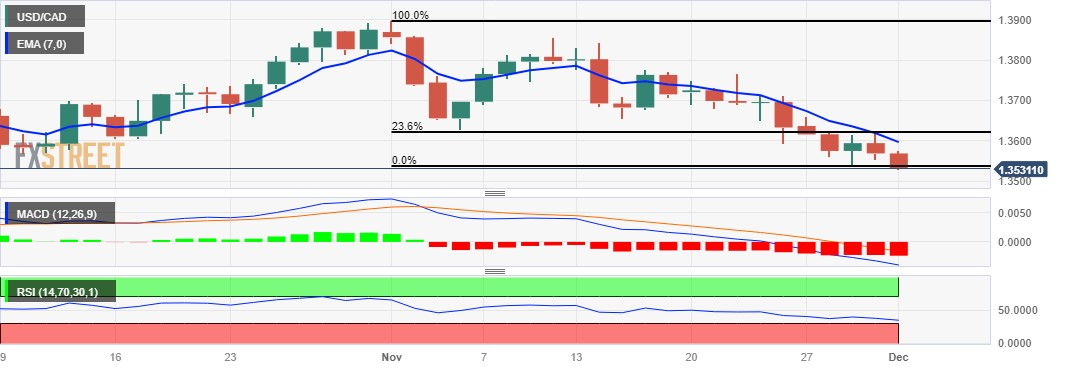
The technical indicators for the USD/CAD pair support the current downward trend. The Moving Average Convergence Divergence (MACD) line is below the centerline and shows the divergence below the signal line, indicating a bearish momentum in the USD/CAD pair.
Furthermore, the 14-day Relative Strength Index (RSI) below 50 indicates a dovish sentiment, indicating that the USD/CAD pair could meet the support around the psychological level around 1.3500, followed by the next support at 1.3450 level.
On the upside, the major level at 1.3550 could act as a key barrier following the seven-day Exponential Moving Average (EMA) at 1.3596 lined up with the psychological level at 1.3600.
A decisive breakthrough above the latter could open the doors for the USD/CAD pair to explore the barrier around 23.6% Fibonacci retracement at 1.3621.
A resurgence in the US Dollar (USD) could motivate the bulls in the USD/CAD pair to target the significant level at 1.3650, with the possibility of reaching the weekly high at 1.3661 if it successfully surpasses the mentioned resistance.
USD/CAD: Daily Chart
(Click on image to enlarge)
USD/CAD: OTHER TECHNICAL LEVELS TO WATCH
| OVERVIEW | |
|---|---|
| Today last price | 1.3533 |
| Today Daily Change | -0.0036 |
| Today Daily Change % | -0.27 |
| Today daily open | 1.3569 |
| TRENDS | |
|---|---|
| Daily SMA20 | 1.3699 |
| Daily SMA50 | 1.3685 |
| Daily SMA100 | 1.356 |
| Daily SMA200 | 1.3518 |
| LEVELS | |
|---|---|
| Previous Daily High | 1.3627 |
| Previous Daily Low | 1.3552 |
| Previous Weekly High | 1.3766 |
| Previous Weekly Low | 1.3594 |
| Previous Monthly High | 1.3899 |
| Previous Monthly Low | 1.3541 |
| Daily Fibonacci 38.2% | 1.3581 |
| Daily Fibonacci 61.8% | 1.3598 |
| Daily Pivot Point S1 | 1.3539 |
| Daily Pivot Point S2 | 1.3508 |
| Daily Pivot Point S3 | 1.3464 |
| Daily Pivot Point R1 | 1.3613 |
| Daily Pivot Point R2 | 1.3657 |
| Daily Pivot Point R3 | 1.3687 |
More By This Author:
GBP/USD Trades Higher Around 1.2650 On Hawkish BoE, Weaker US DollarEUR/USD Hovers Around 1.0900 Amid Falling Inflation, Focus On ECB’s Lagarde’s Speech
Silver Price Analysis: XAG/USD Soars And Breaks Above $25.00, Hits Four-Month High


Comments
Log in or sign up to join the conversation.