
The USD/CAD pair faces pressure while attempting to extend recovery above the psychological resistance of 1.3500 in the European session on Monday. The Loonie asset is expected to resume its downside journey as the broader appeal for the US Dollar remains weak due to firm market expectations for the Federal Reserve (Fed) reducing interest rates in the June policy meeting.
The United States Nonfarm Payrolls (NFP) report for February, released on Friday, indicated that the Unemployment Rate rose to 3.9%, highest in two years, though in a comfortable range and monthly wage growth was significantly slower. On the contrary, labor demand remains robust as employers hired 275K workers against expectations of 200K.
Going forward, the US Dollar will be guided by the Consumer Price Index (CPI) data for February, which will be published on Tuesday and will provide fresh insights into the interest rate outlook.
On the Canadian Dollar front, slower wage growth has softened the inflation outlook. Annual Average Hourly Earnings grew at a significantly slower pace of 4.9% in February from a 5.3% increase in January. This could allow Bank of Canada (BoC) policymakers to consider reducing interest rates ahead.
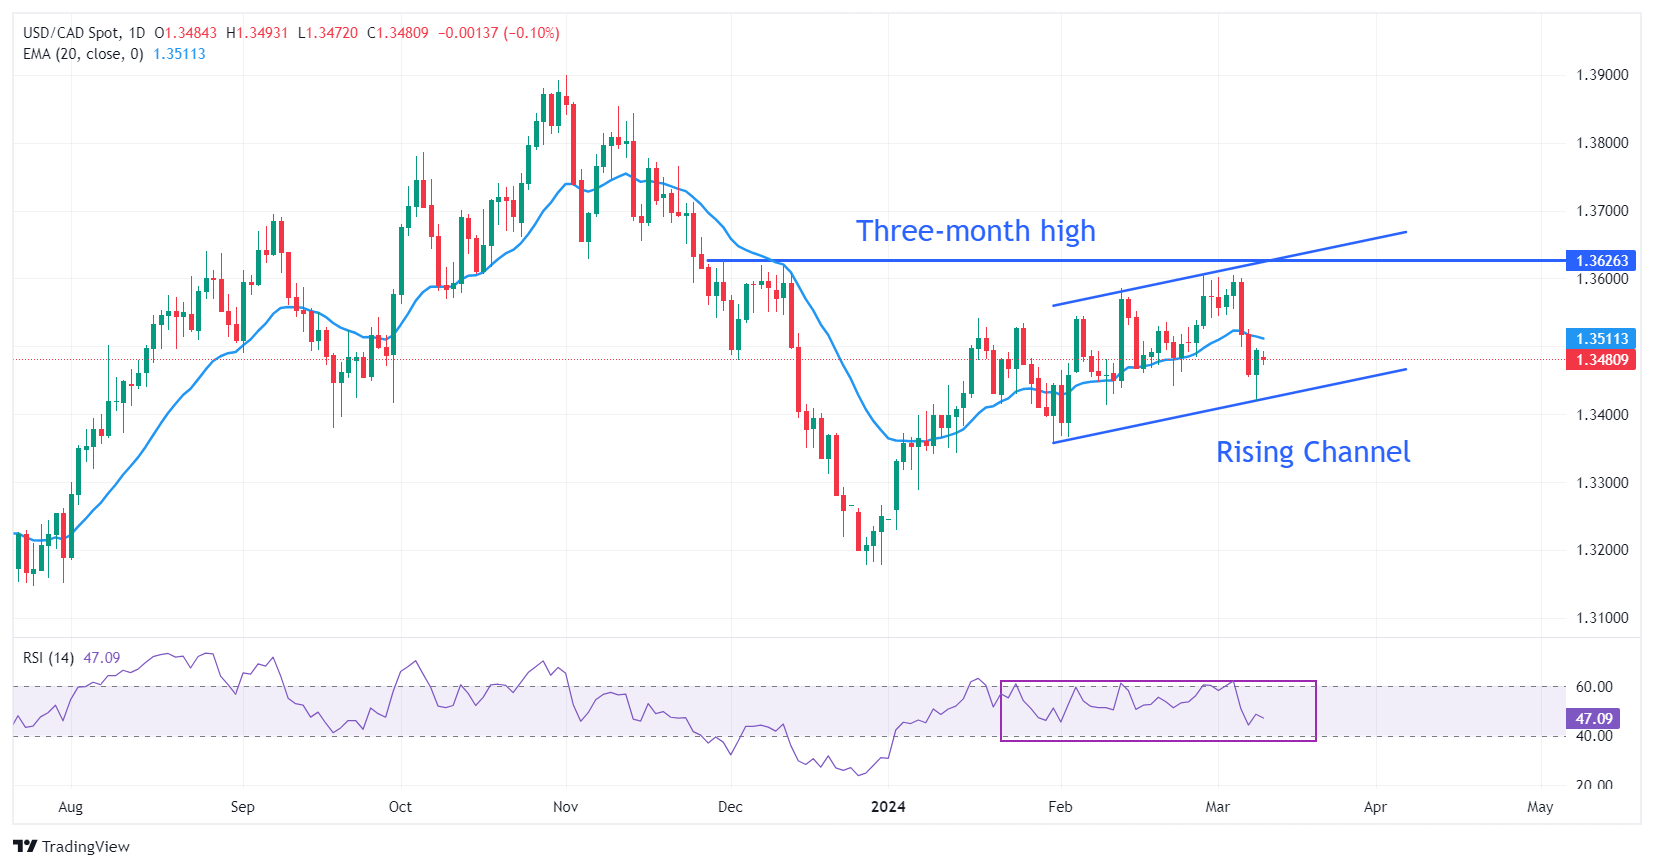
USD/CAD trades in a Rising Channel chart pattern on a daily timeframe. The chart formation exhibits an upside bias with moderate strength, and market participants consider each pullback a buying opportunity. Near-term demand remains downbeat as the Loonie asset is trading below the 20-day Exponential Moving Average (EMA), which trades around 1.3510.
The 14-period Relative Strength Index (RSI) oscillates inside the 40.00-60.00 range, indicating indecisiveness among market participants.
Fresh upside would appear if the asset breaks above January 17 high at 1.3542, which will drive the asset towards February 13 high at 1.3586, followed by the round-level resistance of 1.3600.
On the flip side, a downside move below February 22 low at 1.3441 would expose the asset to February 9 low at 1.3413. A breakdown below the latter would extend downside towards January 15 low at 1.3382.
USD/CAD daily chart
(Click on image to enlarge)
USD/CAD
| OVERVIEW | |
|---|---|
| Today last price | 1.348 |
| Today Daily Change | -0.0015 |
| Today Daily Change % | -0.11 |
| Today daily open | 1.3495 |
| TRENDS | |
|---|---|
| Daily SMA20 | 1.352 |
| Daily SMA50 | 1.3465 |
| Daily SMA100 | 1.3531 |
| Daily SMA200 | 1.3478 |
| LEVELS | |
|---|---|
| Previous Daily High | 1.3498 |
| Previous Daily Low | 1.342 |
| Previous Weekly High | 1.3605 |
| Previous Weekly Low | 1.342 |
| Previous Monthly High | 1.3606 |
| Previous Monthly Low | 1.3366 |
| Daily Fibonacci 38.2% | 1.3468 |
| Daily Fibonacci 61.8% | 1.345 |
| Daily Pivot Point S1 | 1.3444 |
| Daily Pivot Point S2 | 1.3393 |
| Daily Pivot Point S3 | 1.3366 |
| Daily Pivot Point R1 | 1.3522 |
| Daily Pivot Point R2 | 1.3549 |
| Daily Pivot Point R3 | 1.36 |
More By This Author:
EUR/GBP Falls Toward 0.8550 Ahead Of ECB Policy DecisionGold Price Falls Slightly From Near Record Highs Ahead Of Fed Powell’s Testimony
USD/JPY Slumps To 149.50 As Hopes For BoJ’s Policy Normalization Escalate


Comments
Log in or sign up to join the conversation.