USD Weekly Forecast: Solid Jobs Report Supportive Of U.S. Dollar And 75 Bps Rate Hike

Image Source: Pexels
U.S. Dollar Talking Points
- U.S. ISM non-manufacturing PMI numbers are in focus.
- Possible loading from ECB could sap the U.S. dollar over the short-term.
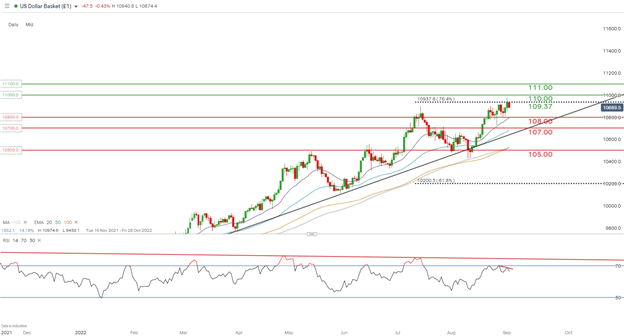
- Bearish divergence is apparent on the daily DXY chart.
U.S. Dollar Fundamental Forecast: Bullish
Last week saw the greenback start of on the back foot as the Dollar Index’s (DXY) main constituent (the euro) found support on the back of an increasingly hawkish European Central Bank (ECB). U.S. data then came to the fore with ISM manufacturing PMI and Non-Farm Payroll (NFP) prints beating estimates, ending the week marginally in the green.
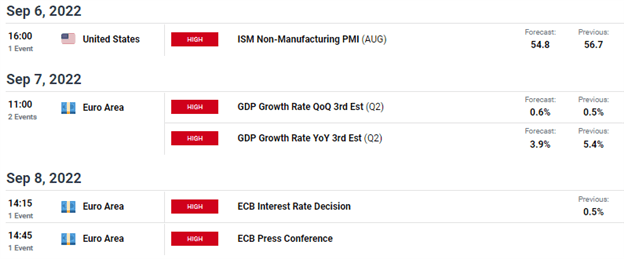
Looking ahead, the economic calendar is comparatively light, with ISM services data dominating headlines. The U.S. economy is, after all, a largely services driven economy and should bring with it some volatility pre- and post-announcement. In addition, the economic release brings with it greater significance now that the Fed has placed more weight on data
Economic Calendar

Source: DailyFX economic calendar
Overall, the U.S. economy looks to be relatively robust, particularly when compared with the European region, meaning aggressive interest rate hikes from the Federal Reserve may not adversely impact the U.S. as much as it would in Europe. Many market analysts are forecasting a 75 bps rate hike from the ECB in the upcoming September meeting. With winter swiftly approaching, the Fed will surely ‘out-hawk’ the ECB in the medium-term.
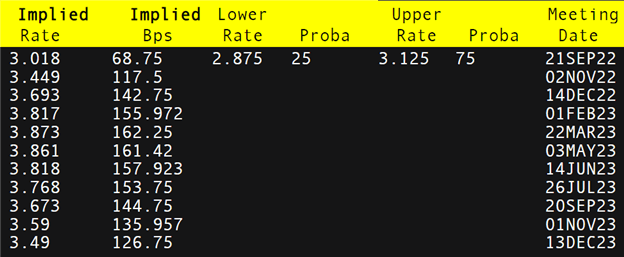
As we can see from the table below, money markets are in favor of a 69 bps hike from the Fed, which should translate to a 75 bps move in late September. Short-term, the ECB rate decision next week could give the euro some backing, especially if they decide to hike aggressively, but the upside should be short-lived, in my opinion.
Federal Reserve Interest Rate Probabilities

Source: Refinitiv
Technical Analysis - U.S. Dollar Index Daily Chart

Chart prepared by Warren Venketas, IG
Price action on the daily DXY chart shows bears defending the 76.4% Fibonacci (taken from July 2001 high to March 2008 low) level at 109.37. The Relative Strength Index (RSI) shows signs of bearish divergence, suggesting an impending reversal. This could fall in line with a hawkish ECB rate decision on Thursday, but longer-term it is difficult to see a buck of the enduring upward trend.
Resistance levels:
- 111.00.
- 110.00.
- 109.37.
Support levels:
- 108.00/20-day EMA (purple).
More By This Author:
Gold Price Forecast: Gold Holds Support As Silver Slides To Two-Year LowsBritish Pound (GBP) Forecast: Sterling's Slide May Continue As New Prime Minister Faces Immediate Tests
US Dollar Strength Persists Ahead Of NFP
Disclosure: See the full disclosure for DailyFX here.


