
US Stocks Rebounded Last Week, Topping Global Market Returns
Equities in the US regained their mojo last week, posting the strongest gain among the major asset classes, based on a set of exchange-traded funds.
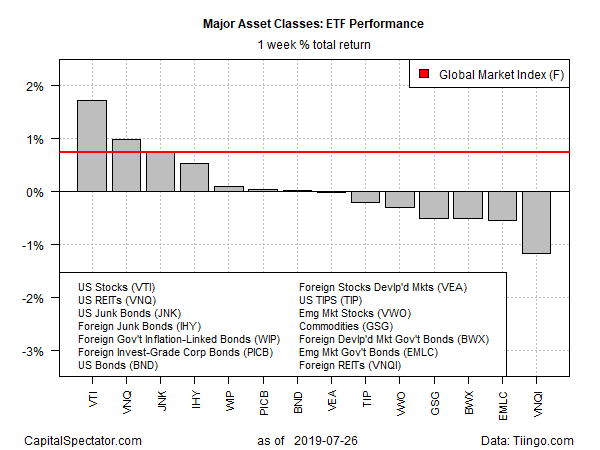
Vanguard Total Stock Market (VTI) jumped 1.7% for the trading week through July 26–the best weekly advance for the fund in more than a month. Adding the bullish aura, VTI’s latest rally lifted the fund to a record high at Friday’s close.
Ed Yardeni, president of Yardeni Research, thinks the recent rally in US stocks is justified, pointing to low inflation and interest rates as catalysts for relatively high equity valuations. “On balance, I believe that the current mix of inflation and interest rates and economic growth merits relatively high, above-average valuations, especially for stocks of companies that can generate consistently above-average earnings growth,” he recently advised.
US real estate investment trusts (REITs) and junk bonds also delivered solid gains last week, courtesy of renewed expectations that the Federal Reserve will cut interest rates this week for the first time in more than a decade. If rates are headed down, the crowd is inclined to revalue yield-oriented securities higher, or at least that was the prevailing narrative last week.
The biggest loser in the final full week of trading in July: foreign real estate securities. Vanguard Global ex-U.S. Real Estate (VNQI) fell for a third week, slumping 1.2%. The ETF closed on Friday at its lowest price for this month so far.
Meanwhile, an ETF-based version of Global Market Index (GMI.F) bounced back last week after a mild fall previously. This unmanaged benchmark, which holds all the major asset classes (except cash) in market-value weights, rose 0.7%. The benchmark has posted gains in seven of the past eight weeks.
For the one-year trend, US real estate investment trusts continue to lead the field by a sizable margin. Vanguard Real Estate (VNQ) is on top with a strong 13.5% total return for the trailing one-year period (252 trading days).
The second-best one-year performer for the major asset classes: US investment-grade bonds via Vanguard Total Bond Market (BND), which is up 7.9% for the trailing 12 months after including distributions.
The one-year laggard is still broadly defined commodities, which continued to post a deep level of red ink at last week’s close. The iShares S&P GSCI Commodity-Indexed Trust (GSG) is down 11.0% as of Friday’s close vs. the year-earlier price.
GMI.F, by contrast, continues to post a moderate increase for the one-year window: 4.6%.

Taking the pulse of all the major asset classes in terms of momentum continues to show a strong bullish bias in most corners of the global markets. The analysis is based on two sets of moving averages for the ETFs listed above. The first compares the 10-day moving average with its 100-day counterpart — a proxy for short-term trending behavior (red line in the chart below). A second set of moving averages (50 and 200 days) represents an intermediate measure of the trend (blue line). On this basis, most of the world’s markets still enjoy upside bias, as of Friday’s close.

Disclosure: None.


