
US Real Estate Shares Topped Last Week’s Market Gains… Again
For a second week in a row, securitized real estate stocks in the US posted the biggest gain for the major asset classes, based on a set of exchange-traded funds. But last week’s trading activity suddenly seems like ancient history this morning in the wake of a sharp wave of selling in overseas markets today.
New worries that US-China talks on trade have hit a wall roiled global markets on Monday. The catalyst for the sudden change in sentiment: a tweet by President Donald Trump, who threatened on Sunday to sharply raise tariffs on Chinese goods. In reaction, markets sold off sharply in Europe and Asia and US futures point to heavy selling this morning at the opening in New York.
Meantime, let’s take a quick review of how last week’s trading fared ahead of what appears to be a rocky week for financial markets.
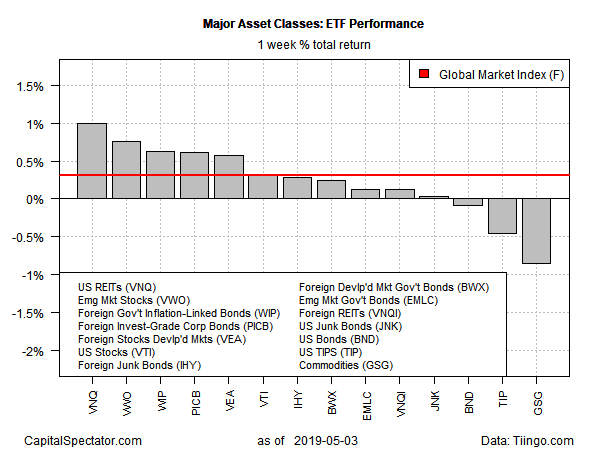
Vanguard Real Estate (VNQ) was the top performer for the major asset classes during the trading week through Friday, May 3. The ETF jumped 1.0%, posting its second weekly gain.
Last week’s worst performer: broadly defined commodities. The iShares S&P GSCI Commodity-Indexed Trust (GSG) fell 0.9%, the third straight weekly loss for the fund.
The Global Markets Index (GMI.F) rose for a second week. This investable, unmanaged benchmark that holds all the major asset classes (except cash) in market-value weights gained 0.3%.
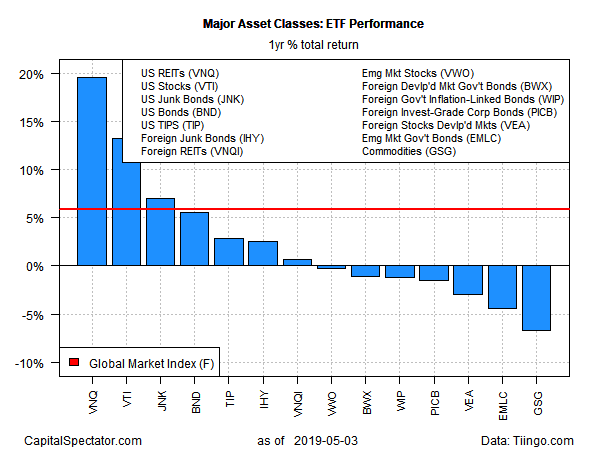
For the one-year change, US REITs continue to lead the field by a wide margin. VNQ is up 19.6% on a total-return basis for the trailing 12-month period. The next-best performer: US stocks via Vanguard Total Stock Market (VTI) is up 13.6% over the past year.
Commodities are still in the last place for the one-year trend. GSG is in the hole by 7.3% as of Friday’s close vs. the year-earlier level.
GMI.F’s one-year return at the moment is a respectable 5.9%.
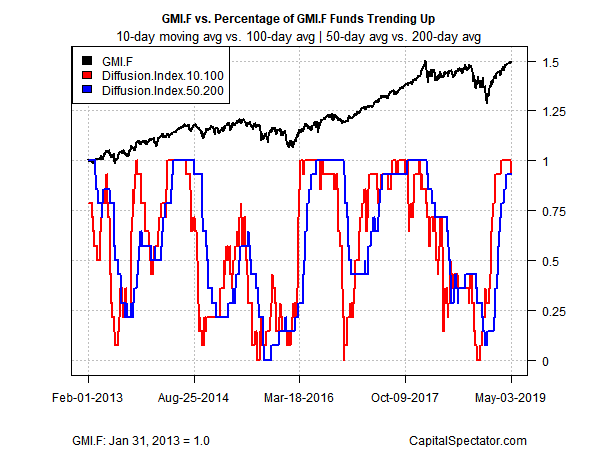
Profiling momentum for all the major asset classes (based on the ETFs above) reflects widespread bullish trends, based on two sets of moving averages. This upside bias looks set to be challenged today and perhaps in the days and weeks ahead, courtesy of the sharp decline in global markets on Monday. Meantime, using numbers through last week’s close paints a clear picture via two metrics. The first definition compares the 10-day moving with the 100-day average, a measure of short-term trending behavior (red line in chart below). A second set of moving averages (50 and 200 days) offers an intermediate measure of the trend (blue line). The indexes range from 0 (all funds trending down) to 1.0 (all funds trending up). Based on data through last week’s close, bullish momentum was conspicuous in nearly every market via the 14 ETFs that comprise GMI.F.
Disclosure: None.


