
U.S. Rates Run As Markets Gear Up For Possible March Rate Hike - Stocks Wobble
Tomorrow brings CPI out of the United States and markets are walking into that release with the expectation that headline inflation may print above 7%. Of recent, this higher inflation impact has been getting priced-in to global markets with an intense move on the short-end of the Treasury yield curve.
The yield on 2-year Treasury notes is .94%, up from a low of .45% in late November. This is a massive jump in a short period of time, and the 49 basis points tacked on to 2-year rates here even eclipses that of the jump in the yield on 10-year notes.
2-Year US Treasury Note Yield
(Click on image to enlarge)
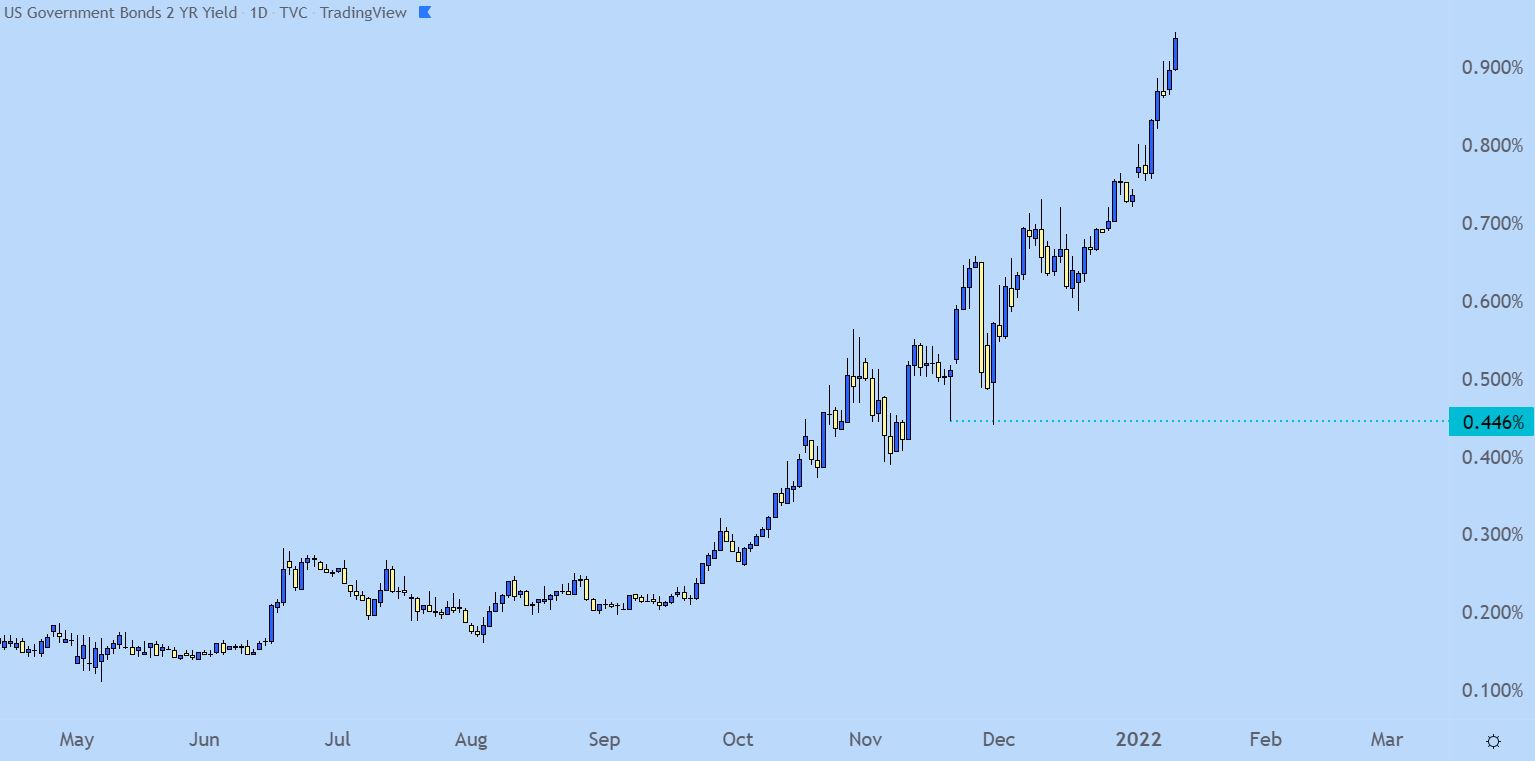
Chart prepared by James Stanley; US02y on Tradingview
The yield on 10-year notes set a fresh high last week after NFP, and this is the highest rate seen since the pandemic came into the equation. Nonetheless, the jump in yield, from the December low up to the recent high, is 46.5 basis points, less than that of the 2-year note looked at above.
10-Year U.S. Treasury Note Yield
(Click on image to enlarge)
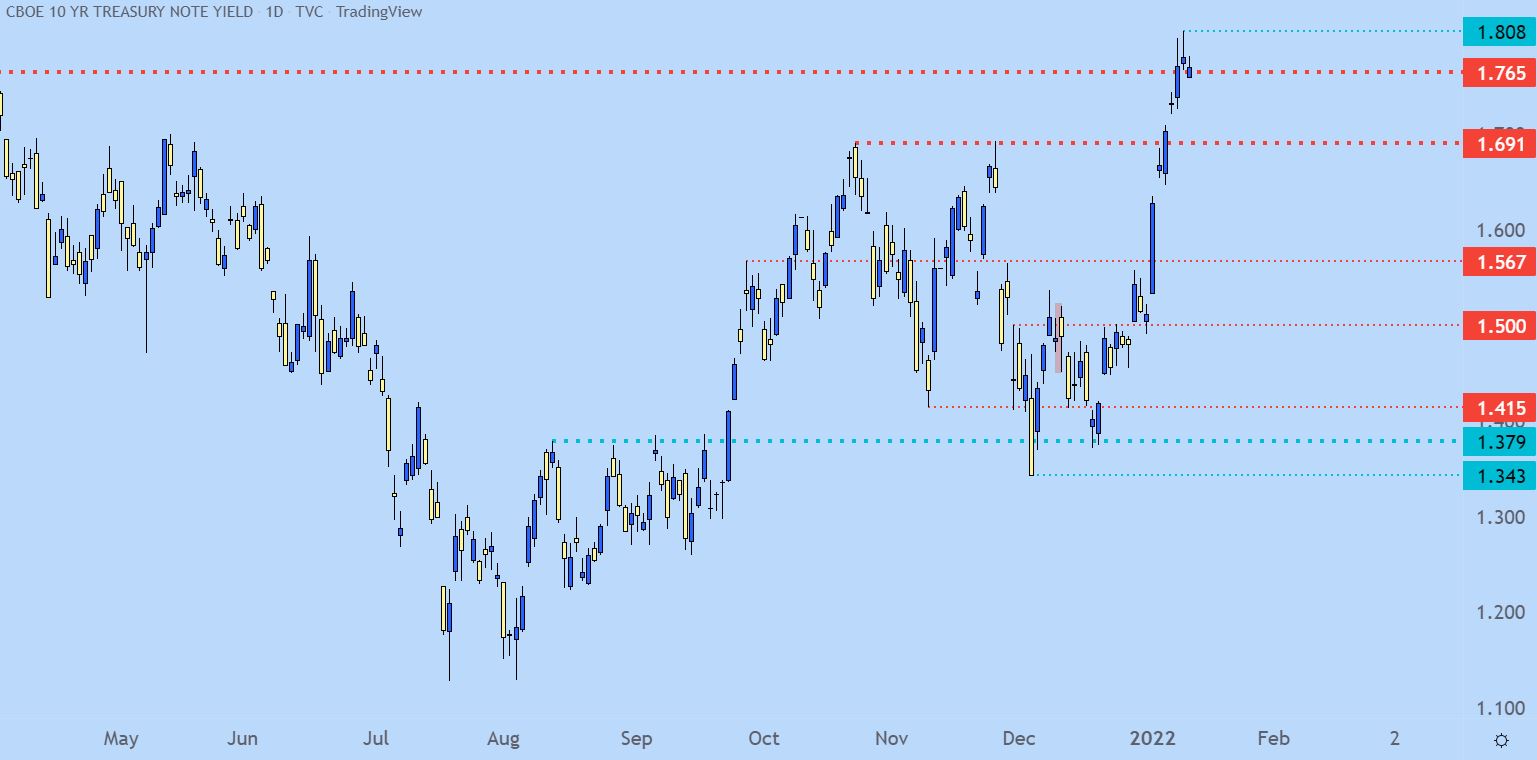
Chart prepared by James Stanley; TNX on Tradingview
The 30-year Treasury bond has similar seen yields move up but, again, less than that seen on the short-end of the curve with the 2-year note. After setting a December low at 1.678%, yields bumped up to a fresh high of 2.151% last week. This is a difference of 48 basis points, less than that of the 2-year but a bit more than what’s so far been seen in the 10-year.
Yield On 30-Year Treasury Bonds
(Click on image to enlarge)
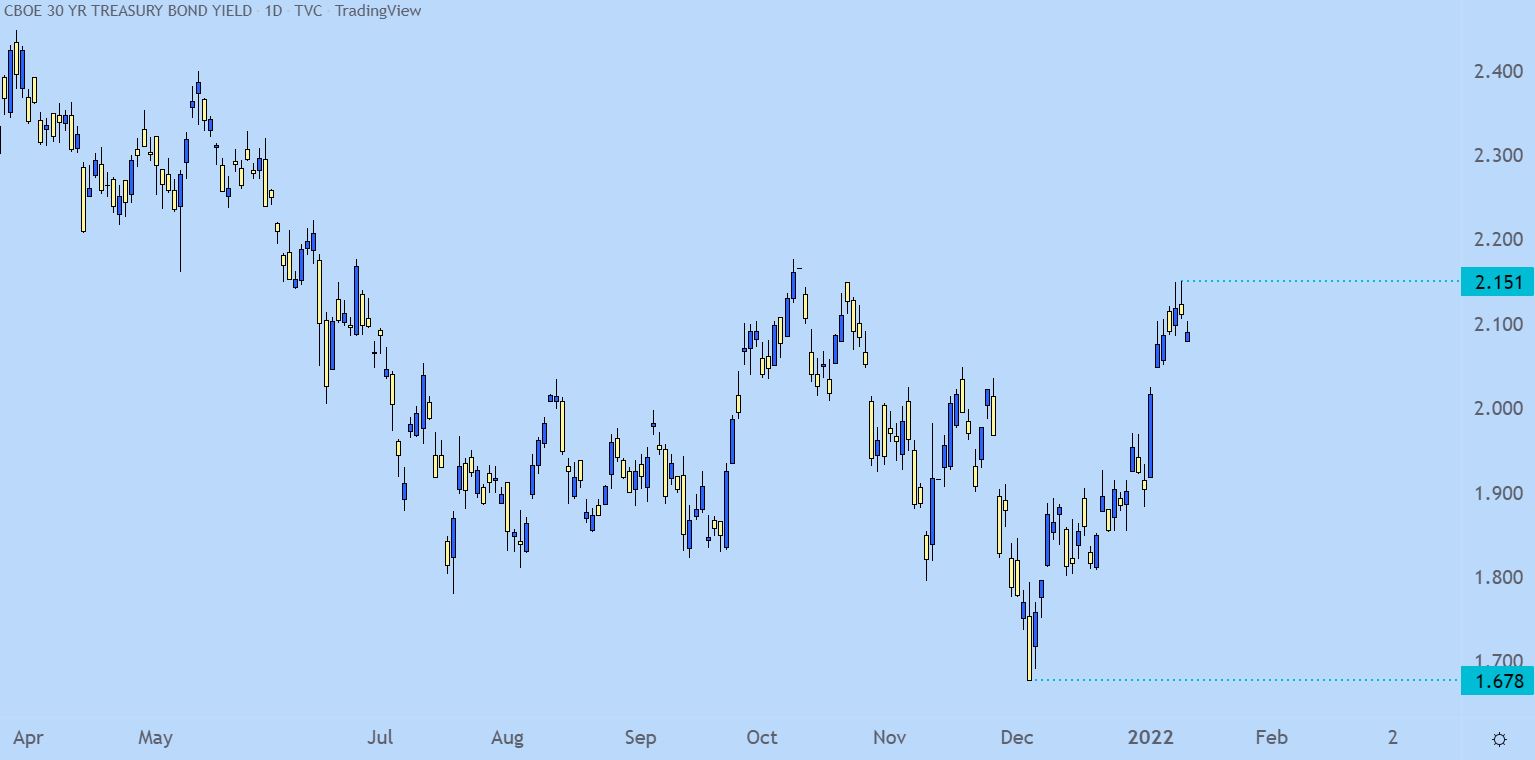
Chart prepared by James Stanley; TYX on Tradingview
Treasury Yield Curve Compression
As yields have continued to rise with a greater focus on the short-end of the curve, those dynamics have started to get priced-in to equities, as well.
The rate-sensitive Nasdaq 100 has been particularly interesting of late. After spending the entirety of last year riding in a bullish trend channel that started around the US election in 2020, prices have already started to threaten a break.
Yesterday saw the first test below this channel in over a year. Prices quickly jumped back above, but this may be a situation where the seal is now broken and bears may go for a deeper push here. As looked at last week, a continued rise in yields can keep the focus on the downside for the Nasdaq 100 index.
Nasdaq 100 Daily Price Chart
(Click on image to enlarge)
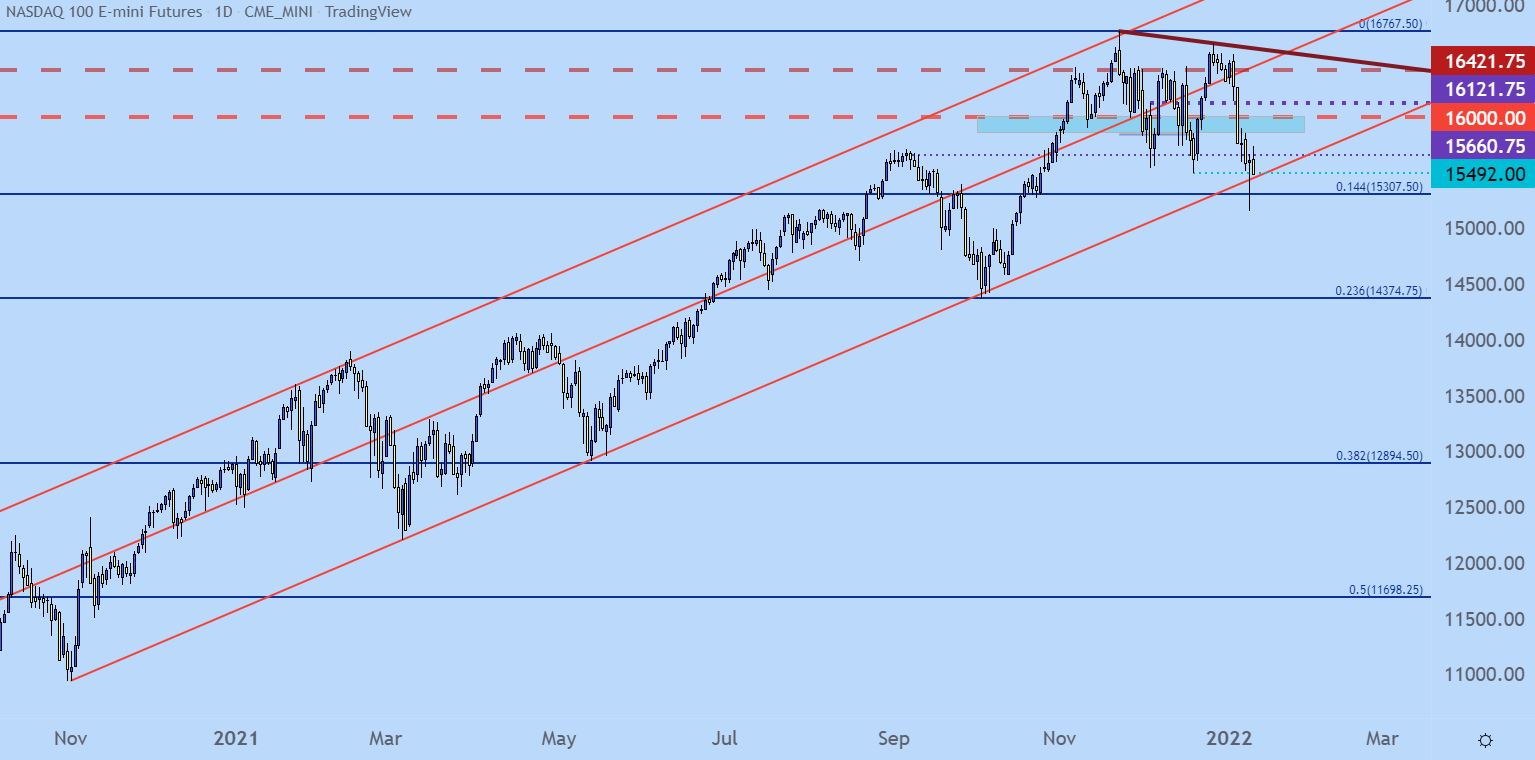
Chart prepared by James Stanley; Nasdaq 100 on Tradingview
S&P 500
The S&P has been similarly shaky but, so far, it’s held up a bit better than the Nasdaq 100. There is a major spot of support, however, that was tested again yesterday around the 4600 handle. That’s so far led to a bounce, but sellers are back on the prowl this morning and as markets gear up for a more-hawkish Fed and perhaps even a March rate hike, there’s bearish potential here, as well. The next significant spot of support is around 4500 with another spot between that level and current prices around 4550. If the S&P cannot hold 4500 then a deeper sell-off could develop very quickly.
S&P 500 Four-Hour Price Chart
(Click on image to enlarge)
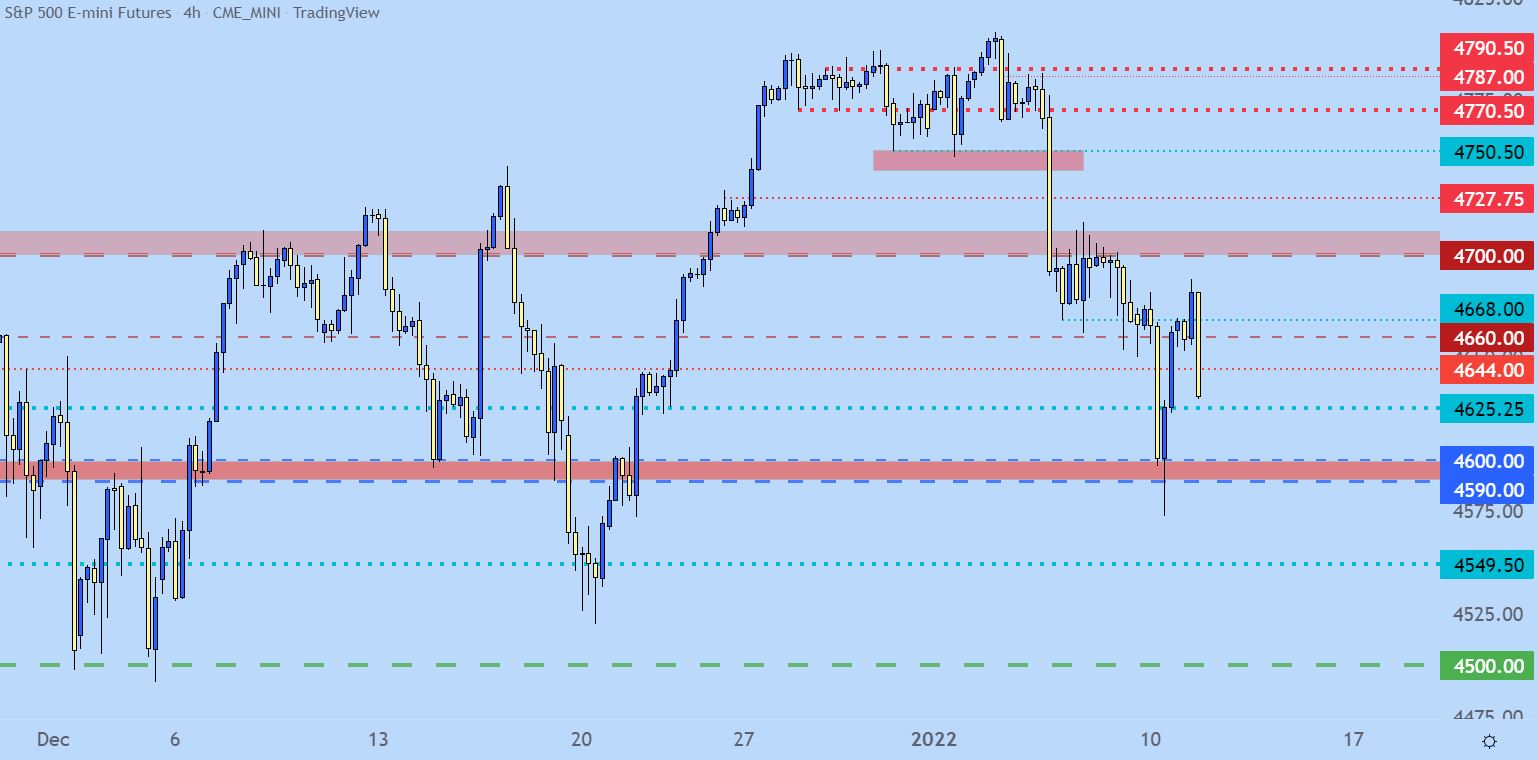
Chart prepared by James Stanley; S&P 500 on Tradingview
Disclaimer: See the full disclosure for DailyFX here.


