U.S. New Home Market Shrank In 2021
The U.S. new home market shrank in 2021.

That result can be seen in the latest update of our chart tracking the trailing twelve month average for the U.S. new home market market capitalization, which dropped to an initial estimate of $26.64 billion in November 2021. That is 11.5% below the finalized estimate of $30.12 billion recorded in December 2020.
Substantial downward revisions in the estimates of new homes sold in August through October 2021 point to an acceleration in the contraction of the new home market since July 2021. Though December 2021's new home sales and several months of data revisions still lie ahead before 2021's data is fully finalized, it is unlikely they will alter the outcome that the new home market shrank during the year.
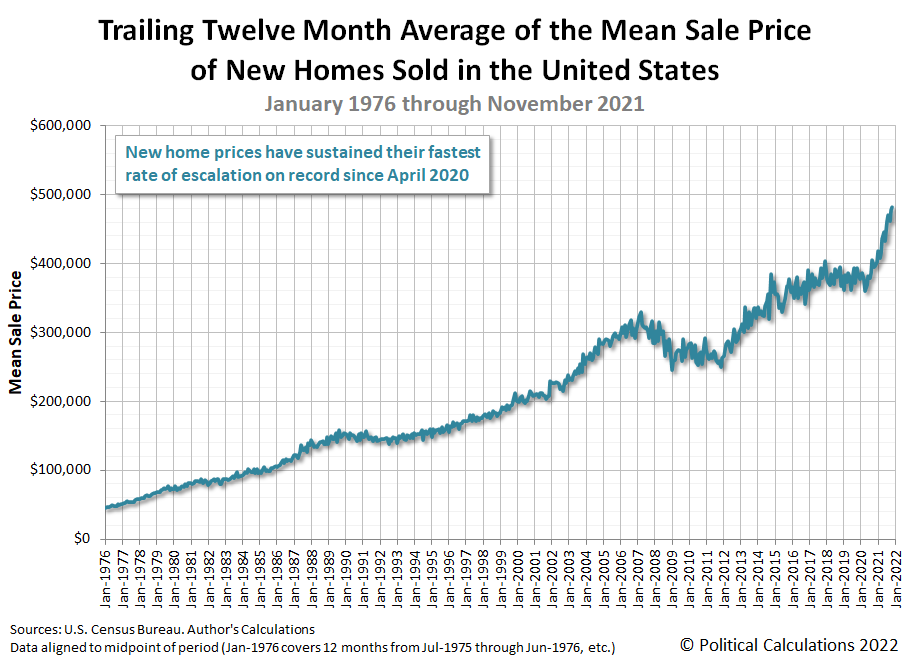
That's despite the ongoing escalation in the national average price of new homes sold. The following chart shows that escalation, with home prices in recent months growing at their fastest pace on record.
Although the inflation of new home prices is propping up the new home market cap, the number of new homes being sold has been falling throughout 2021. Our third and final chart shows that recent downward trend in the trailing twelve month average of the annualized number of new homes sold in the U.S.
References
U.S. Census Bureau. New Residential Sales Historical Data. Houses Sold. [Excel Spreadsheet]. Accessed 23 December 2021.
U.S. Census Bureau. New Residential Sales Historical Data. Median and Average Sale Price of Houses Sold. [Excel Spreadsheet]. Accessed 23 December 2021.


