
↵

Image Source: Pexels
US market rates have a strut about them. And why not. Jobs galore is seems (latest payrolls report). We’d called for a backup in rates. What’s next? We’re at near completion of the first leg of our post-rate-hike process. That builds room for a reversion back down. But don’t get too carried away, as even at current levels, the 10yr rate is low vs equilibrium.
Big picture – The 10yr bottoms, then backs up, and then hits a new bottom. And then rises and rises...
We sent out a short report as the Federal Reserve (Fed) cut rates by 50bp, where we called for the US 10yr Treasury yield to back up to the 3.9% area, and have a go at breaking above 4%. It's here. The question now is what's next. The part answer has the latest payrolls report ringing in our ears. It was undeniably strong, and was enough to prompt the 10yr yield to a final push to 4%. It also now rationalises the 10yr remaining with a 4% + handle, at least until there is a valid excuse to break back lower. We maintain our stance that that excuse will most likely come through a future payrolls report. A wobble there, and the 10yr yield can sail lower; partly as that's what the 10yr yield has tended to do historically. It has tended to ultimately get below the level hit just as the Fed delivers it's first cut, and often with a lag of a few months.
The US 10yr Treasury yield (focus on end of hiking and start of cutting)
Blue line: The moment the Fed peaks (last hike of the cycle)
Orange line: The moment the Fed cuts (first cut of the cycle)
(Click on image to enlarge)
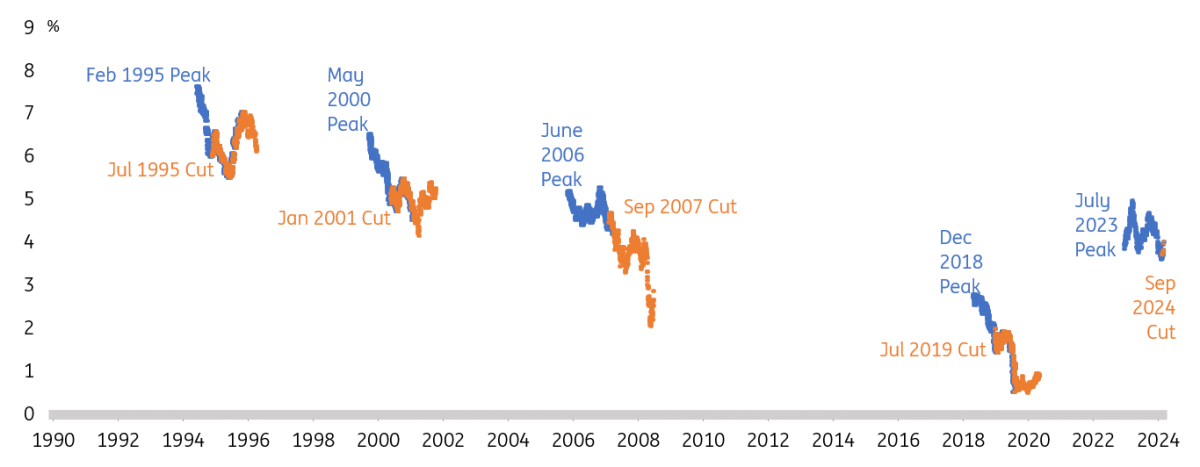
Source: ING estimates, Macrobond
A key change post payrolls is the market discount for the terminal funds rate. Before payrolls the implied bottom for the funds rate was 2.75% to 3.00%. Now the implied bottom is 3.25% to 3.50%. This is, in fact, now in line with our view. Landing here would leave policy a tad tight versus neutrality, but still a meaningful 200bp below the peak. The market now has a point estimate bottom of 3.3%. That constrains how low the 10yr SOFR rate can get to. In fact, if 1mth SOFR is discounted to bottom at 3.3%, the 10yr SOFR rate should not really be trading below this level. Can it? Sure it can. A re-deepening in the rate cut discount is the cleanest way. But that most likely requires the aforementioned "payrolls wobble moment" required to force that test in the first place. Until then, the pressure remains up for 10yr market rates.
Context – Relative to a mythical risk free curve from a 3% fed funds to a 4% 10yr SOFR
Let's inject some context. In the back of our minds we have a mythical equilibrium curve that extends from a funds rate at around 3% to a 10yr SOFR rate at around 4%; a 100bp curve. We explain why here. We then confront reality against that. On the front end, the Fed has started a rate-cutting process, and has considerable runway, while remaining tight versus "normal". On a 1yr forward basis, the 1yr SOFR rate hits the discounted bottom at 3.3%; slightly above "normal", but not significantly so. The forward profile for 1mth SOFR then essentially flat-lines in the 3.3% area for the coming four years. While an unlikely outcome, it's not a mad discount. It's one that bascially says the Fed cuts to a low, and then the market really does not know after that.
But what about the 10yr? Let's start with SOFR, as that's the purest extrapolation of the Fed funds rate. SOFR maps the risk-free rate out the curve. The market discount has 10yr SOFR flat-lining at 3.5% (where it is now) over the coming 3-4 years. As highlighted above, we think the equilibrium is around 4%. So at 3.5%, the 10yr SOFR rate is rich versus the 4% "normal" level. That does not necessarily mean it must jump to 4%, as a solid rationale for being meaningfully below 4% centres on recessionary risks ahead. Even if these have been muted somewhat by the latest payrolls report, they are still there. As noted above, a payrolls wobble can accelerate a drive back to prior lows (3.15% for 10yr SOFR), or slightly below. How low depends on how many cuts the market settles on, before delivery.
SOFR and its forward discount
(Click on image to enlarge)
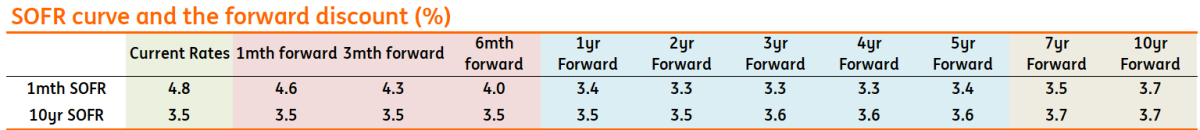
Source: ING estimates, Macrobond
The market has a point estimate bottom of 3.3% for 1mth SOFR. The forward profile for 1mth SOFR essentially flat-lines in the 3.3% area for the coming four years. And 10yr SOFR essentially flat-lines at 3.5% (where it is now) in the coming years. It's highly unlikely that that's the actual outcome. If the 1mth SOFR rate bottoms at 3.3%, the 10yr SOFR rate can't stay at 3.5%. It must have a tendency to be higher. Beyond our view that 4% represents equilibrium, the curve should have a steeper profile than the forwards predict. Once the funds rate bottoms, and the market understands it to be a bottom, it will then price an expectation for rate hikes and by extension an upward sloping curve. This will occur whether rate hikes are subsequently delivered or not.
The Treasury curve and why there are material limits to how far yields can fall ahead
Let's extend this to Treasuries. To derive the 10yr Treasury yield we need to add 45bp (rounded to 50bp) to 10yr SOFR. This spread has been edging higher in the past few quarters, we think reflecting elevated Treasury issuance pressure. And as would be expected, the spread rises on extensions along the curve (it's about 20bp on the 2yr). In consequence the 10yr Treasury yield, which is now at 4%, stretches to 4.15% on the 2yr forward and 4.3% on the 3yr forward (in turn reflecting a steeper Treasury curve versus the SOFR curve). The forwards also impliedly discount a widening in the 10yr SOFR-Treasury spread to 65bp on the 2yr forward and 70bp on the 3yr forward. Importantly, this SOFR spread to Treasuries has no right to tighten while issuance pressure remains elevated. It should in fact continue to widen.
Why? Even if the funds rate is discounted to bottom at 3.3%, we need to add a 50bp spread to this to get an absolute bottom for the 10yr Treasury yield. That gives us 3.8% as a current "floor" for the 10yr Treasury yield. The rationale here centres on a 10yr Treasury yield at 3.8% equating to a 10yr SOFR rate around 3.3%, which is flat to the bottom for the Fed funds rate as currently discounted.
Is this a hard floor? No. It can be broken to the downside. But that would require a sensible excuse to do so, which we currently don't have. And like the SOFR story above, a move lower in the funds rate bottom also moves lower capacity for the 10yr Treasury yield to fall. For now, however, a settle with a 4% + handle makes more sense, with an upside tilt until negated by the macro data or events.
Lets be clear here on what we're saying here. The 10yr SOFR rate is now 3.5%. We think it can drift up to 3.6% or maybe 3.7% given the strength shown by the latest payrolls report. But any material upmove is constrained by the recessionary risk ahead.
Should we see a payrolls wobble, then we're asking how low 10yr SOFR can get to. Right now there is an implied floor at 3.3%. That floor can shift lower, but we doubt to below 3% at this juncture. The 10yr SOFR rate has no right to break below that unless something drastic happens that we currently don't have on the radar.
The window for the upside test in market rates is now till the payrolls wobble (could be the next one, but could also be the one after). The window for the subsequent move lower then opens, and how far we push depends on the severity of the wobble, and whether it persists. But crucially, provided the 3% to 3.3% bottoming area for the funds rate remains, there is a floor for the 10yr Treasury yield in the 3.5% to 3.75% area. This likely plays out over the remainder of 2024.
Beyond that, we continually think of convergence back to equibrilium rates as a logical path to persue whenever things are looking to be converging on normal. If the funds rate settles at "around" 3% (but not below), then we look to 4% for the 10yr SOFR rates and 4.5% for the 10yr Treasury yield as levels to trend towards. And likely to end up at above those levels when elevated issuce is factored in.
Risk Case. If, for whatever reason, the Fed aborts it's rate-cutting cycle materially shorter than is discounted (e.g. stops in December; not our view). Then we forget the reversion lower, and rather fast-track towards the equilibrium levels for the 10yr; and more likely, over and beyond.
More By This Author:
NBR Review: Better Treat Uncertainties SeriouslyReserve Bank Of New Zealand Preview: We Expect A 50bp Cut
Surging US Jobs Suggests The Fed Needs To Tread Carefully

Comments
Log in or sign up to join the conversation.