

Image Source: Pixabay
The Federal Reserve’s favored inflation measure rose 0.2% MoM. That’s what we need to see to soothe the Fed’s inflation worries, but one is not enough. We need a series of 0.2% readings between now and September, with further slack in the jobs market and more evidence of a cooling consumer spending story. All is certainly possible, but by no means guaranteed.
Cooling inflation helps the case for a September rate cut
So the Federal Reserve's preferred measure of inflation, the core personal consumer expenditure deflator, has come in at 0.2% month-on-month - the consensus had been swinging between 0.2% and 0.3% all week largely because based on the inputs from the PPI and CPI reports, the general sense was that it would come in at somewhere between 0.22 and 0.28% to two decimal places. In the end, it came in at 0.249% - so just a tiny fraction away from a 0.3% print - we need to see it consistently hit 0.17% month-on-month to bring inflation down to 2% year-on-year, so it does remain too hot, but the momentum is encouraging after some early 2024 disappointment. Overall it is modestly supportive of a September rate cut, but we need to see at least two more 0.2% prints between now and then, further evidence of cooling consumer spending and the unemployment rate moving higher to perhaps the 4.2% region. All is possible, but not guaranteed.
Core PCE deflator MoM, YoY, and 3M annualised % change
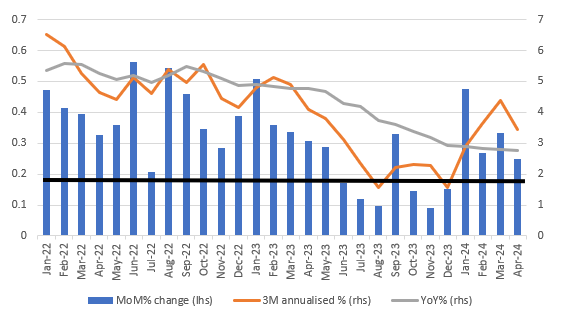
Source: Macrobond, ING
Spending surprisingly falls, income is weak
Elsewhere, the report is soft with real consumer spending falling 0.1% MoM rather than rising 0.1% as expected, setting us up for a potentially subdued 2Q consumer spending contribution to GDP. Real household disposable incomes also fell for the second time in three months. As the chart below shows, it has barely moved over the past year and consequently has not been the key driver of consumer spending strength. Instead, we put that down to the run down of pandemic-era accrued savings and consumer credit.
Real household disposable income $bn
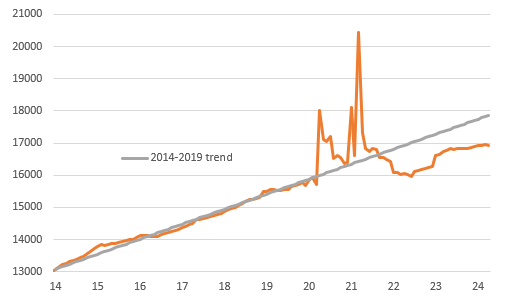
Source: Macrobond, ING
Remember, too, that the top 20% of US households by income spend the same amount of money as the bottom 60% of households by income. The top 20% are doing very well with good, high-paying jobs, tending to own their own home (largely with low long-term mortgage rates), and can make 5% in money market funds while feeling the benefits of higher stock and home prices. The bottom 60% are feeling more stress with far less wealth exposure. They are more likely to rent and are more likely to have exhausted pandemic-era-accrued savings.
With consumer loan borrowing costs at multi-decade highs, the financial pressure many households are facing is showing up in rising delinquencies. The key question for the spending and growth in general is how long that top 20% can keep offsetting intensifying stresses faced by the bottom 60%. We see the story moving in the direction of weaker spending as we head through the rest of the year. Coupled with our inflation and cooling jobs market view, this feeds through into our view of a September Federal Reserve interest rate cut with the policy rate ending the year at 4.75%.
More By This Author:
Italian GDP Growth Confirmed As Demand Breakdown Adds Upside Risks For 2024
Eurozone Inflation Jumps Ahead Of ECB Meeting
Rates Spark: Higher PCE Inflation Would Keep The 10yr Target At 5%


Comments
Log in or sign up to join the conversation.