
US Dollar Reacts At Resistance: ECB, BoE Highlight This Week
FX TABLES SET FOR A BIG WEEK OF DATA
It’s been somewhat of a slow open to September after an abnormally busy summer across FX; but with a fairly full economic docket for this week, the impasse may be soon giving way. The US Dollar has been in a state of flux since mid-August, with prior levels of relevance at 95.00 and 95.53 coming in to help to establish near-term support and resistance.
US DOLLAR TWO-HOUR PRICE CHART
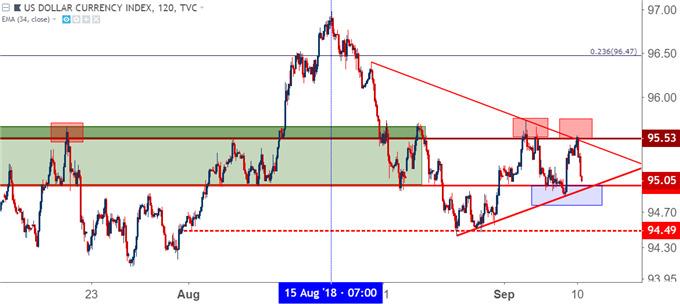
Chart prepared by James Stanley
On a longer-term basis, the question of big-picture direction remains. The US Dollar has spent the early portion of the new month re-engaging a range that was in play earlier in August, and this comes around an area that’s been holding resistance in the currency since late-May. This brings the question to the US Dollar’s longer-term direction after the Q2 bullish breakout has largely been in a state of stall for the past four months, following a very strong six-week period in April and May.
US DOLLAR MONTHLY PRICE CHART: TWO MONTHS OF STRENGTH, FOUR MONTHS OF STALL
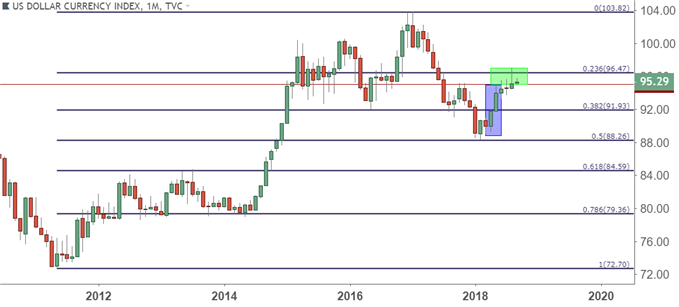
Chart prepared by James Stanley
ECB, BOE HIGHLIGHT BUSY ECONOMIC CALENDAR
This week’s economic calendar picks up a bit, with Thursday looking to be especially busy. This Thursday begins with the Bank of England’s September rate decision at 7:00 AM ET. And while not much is expected to take place there, it leads into what will be a highly-watched European Central Bank rate decision. The ECB previously announced intentions to wind down their QE program by the end of this year, while heavily inferring that September would be the month in which they begin to whittle down purchases. All eyes will be on the ECB for the rate decision at 7:45 and the accompanying press conference set to begin 45 minutes later. That 8:30 spot is also when we see the release of US inflation numbers for the month of August, and this can put EUR/USD in a rather vulnerable position as we’ll be seeing high-impact drivers pushing at the same time on both sides of the pair.
DAILYFX ECONOMIC CALENDAR: HIGH-IMPACT ITEMS FOR THE WEEK OF SEPTEMBER 10, 2018
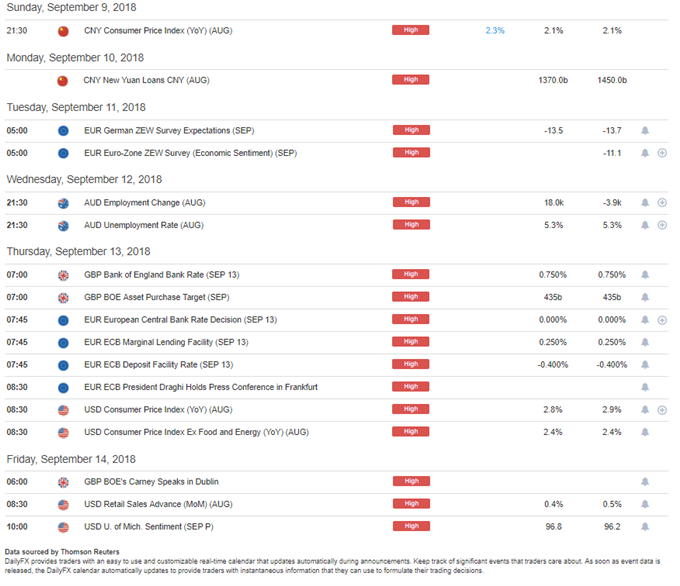
Chart prepared by James Stanley
EUR/USD DESCENDING TRIANGLE: OPENS THE WEEK WITH A SUPPORT CHECK AT 1.1530
EUR/USD will likely be on the move this week given the drivers on the calendar, and the big question is whether we can break the recent impasse in the pair. While the first half of August had appeared to re-open the door to bearish continuation, prices caught support mid-month, and in short order that bearish trend had begun to pullback. The second half of the month saw almost the entirety of the early-August sell-off erased, and prices held in a big zone of resistance as we closed August and opened September.
EUR/USD EIGHT-HOUR PRICE CHART: AUGUST RESISTANCE HOLDS 1.1709-1.1750, SUPPORT AT 1.1530
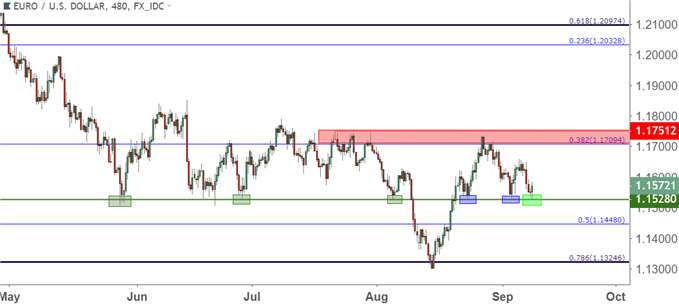
Chart prepared by James Stanley
But bears have now been thwarted twice at the 1.1530 level already in September. This is an area of support that’s been at work in the pair since the month of May. Last week opened with selling in the pair until buyers stepped-in around this familiar support level at 1.1530. And then after a build of lower-high resistance, another support checked showed shortly after this week’s open, taking place in the overnight session ahead of the open of US trade.
Given this horizontal level of resistance coupled with recent lower-highs, and we have a descending triangle formation in EUR/USD as we approach that ECB meeting on Thursday. This type of formation will commonly be approached with a downside bias, looking for the motivation that’s helped bears to come-in at lower-highs to eventually carry through to a support break and lower-lows.
We looked at bearish strategies in the pair as part of our FX Setups for the Week of September 10, 2018; looking for lower-high resistance to open the door to short-side strategies.
EUR/USD HOURLY PRICE CHART: DESCENDING TRIANGLE
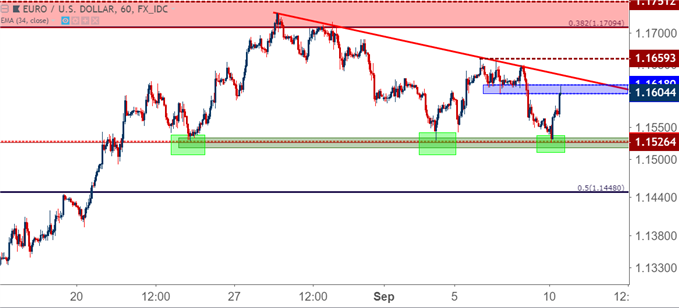
Chart prepared by James Stanley
US DOLLAR RE-ENGAGES EARLY-AUGUST RANGE
In the US Dollar, the question of longer-term direction remains. After a brutal 14-month sell-off, USD found support at the 50% marker of the 2011-2017 major move. This is the chart that we showed earlier in this article, and after that level came into play, USD declines stalled for two months from February-April ahead of a return of bullish price action.
But that bullish move in the US Dollar pretty much only showed in late-April and May. This is also when the Euro was getting slammed around fears from Italian politics, so there was likely a quotient of risk-aversion in this topside USD push, and by the end of May DXY had set a fresh swing-high at the 95.00 level.
But – four months later and that 95.00 level is still in play. We saw this as support last week, coming-in shortly after resistance played-out of the prior June/July swing-highs. Prices moved-down to test support below 95.00 ahead of NFP, and rallied after the print. That strength lasted through this week’s open, with USD price action finding yet another resistance reaction off of 95.53. The big question now is whether buyers can hold the lows on a subsequent retest of support.
US DOLLAR EIGHT-HOUR PRICE CHART: 95.50 RESISTANCE STRIKES AGAIN, CAN BUYERS HOLD SUPPORT ABOVE 95.00?
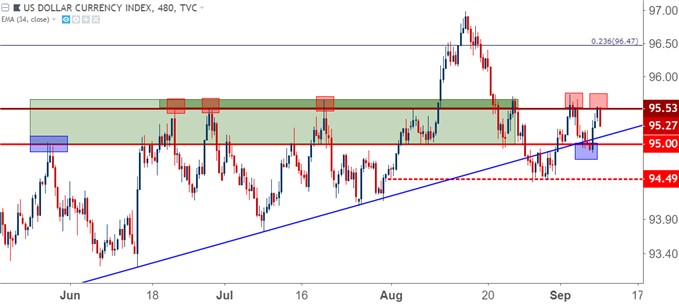
Chart prepared by James Stanley
GBP/USD: MESSY PRICE ACTION REMAINS, BUT CAN BULLS SHOW THEIR HAND?
It’s been a messy couple of weeks for the British Pound as Brexit-headlines have been actively pushing price action in both directions. The announcement from a couple of weeks ago in which the EU’s Chief Negotiator mentioned a post-Brexit partnership with the UK seemed to shift the mood a bit, as fears or threats around a Hard-Brexit or No-Deal Brexit don’t appear to be carrying the same weight across price action as what we saw earlier this summer.
And while near-term prices continue to show some element of whip, the fact that buyers have finally been able to hold-up some support is mildly encouraging for bulls. The mild aspect of that encouragement would come from the fact that we’re still seeing some considerable volatility in near-term prices that could make the prospect of bullish strategies a bit of a challenge at the moment.
Prices gapped-lower last week and sold off on Monday and Tuesday. A bit of support began to show around the prior low of 1.2800 on Wednesday, and after a sharp move-up, prices have settled with lower-high resistance showing around the 1.2900 handle.
GBP/USD FOUR-HOUR PRICE CHART: PRICE ACTION WHIPSAW AS BREXIT-HEADLINES PUSH THE FLOW
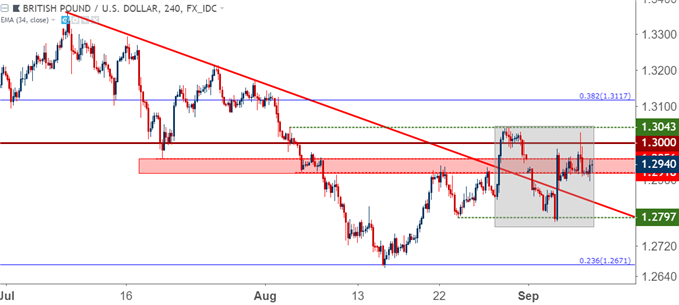
Chart prepared by James Stanley
Making matters a bit less enthusiastic for bulls is the fact that much of this recent top-side move may be emanating from short-cover. Looking at shorter-term charts will highlight just how quickly these bullish themes have been prices in, while the corresponding pullbacks have been slow burns-lower. This would be somewhat of the opposite of the phrase ‘up the stairs and down the elevator,’ indicating that these positive announcements around Brexit are encouraging longer-term short positions to cover.
Given how oversold the pair was in mid-August, this makes sense. We had looked at bullish GBP/USD positions last month largely on the basis of just how oversold the pair had become, so the idea of sharp topside moves as positive items around Brexit are availed aligns well with the thesis of these bullish themes being driven by short-cover in GBP/USD.
GBP/USD HOURLY PRICE CHART: SHARP TOPSIDE MOVES INDICATE SHORT-COVER POTENTIAL
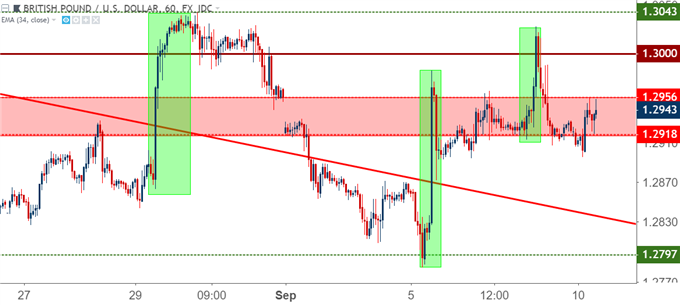
Chart prepared by James Stanley
Disclosure: Do you want to see how retail traders are currently trading the US Dollar? Check out our IG Client Sentiment ...
more

