
US Dollar Price Volatility Report: WTO, Fed & ISM Manufacturing
The US Dollar notched a new 2019 record high as the DXY Index jumped to an intraday top of 99.46 before receding slightly. US Dollar strength has been an ongoing trend this year and resulted in several year-to-date highs recorded by the DXY Index so far, which is a trend that may very well continue into the fourth quarter beginning this week.
Though the DXY Index has eclipsed its prior year-to-date high of 99.37 printed on September 03, the popular benchmark of major USD currency pairs remains below rising trendline resistance and keeps the door open for further upside potential. The upward-sloping RSI and bullish divergence on the MACD indicator also suggest upside momentum is gaining traction, which we have previously noted in our US Dollar price volatility report published daily. Looking ahead, however, there are several fundamental factors that threaten USD price action.
DXY US DOLLAR INDEX PRICE CHART: DAILY TIME FRAME (APRIL 16, 2019 TO SEPTEMBER 30, 2019)
(Click on image to enlarge)
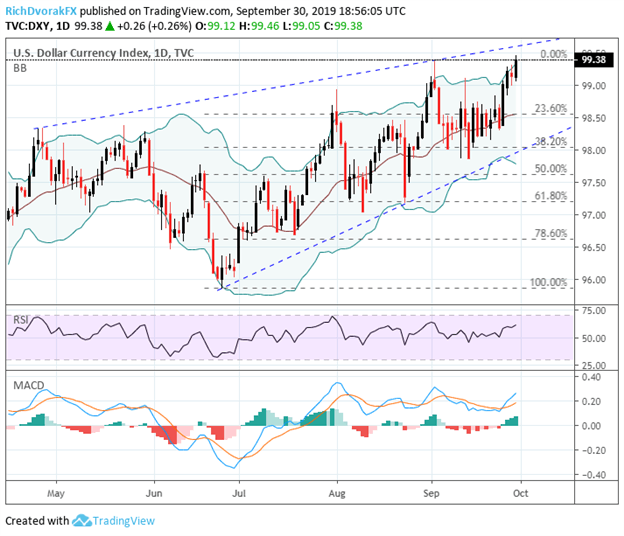
Chart created by @RichDvorakFX with TradingView
Greenback gains have been broad as the world’s reserve currency catches bid primarily in response to slowing global GDP growth and heightened trade war uncertainty. While the US-China trade war has been the center of attention across major media outlets, there has been an ongoing risk that protectionist trade policies and tit-for-tat tariff battles will spill over into the Eurozone – even despite Trump’s auto tariff delay.
A more immediate threat highlights the World Trade Organization (WTO) ruling due this week and whether it will authorize the US to slap tariffs on roughly $7.5 billion of European goods annually as a result of the decade long debate over illegal subsidies provided to Airbus. If the WTO rules in favor of the US and President Trump decides to move forward with levying tariffs on the EU, which is likely to be met with the Eurozone lobbing over retaliatory tariffs, spot EURUSD could continue its drift toward 2017 lows.
US DOLLAR IMPLIED VOLATILITY & TRADING RANGES (OVERNIGHT)
(Click on image to enlarge)
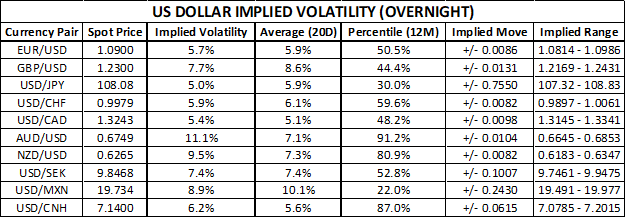
Aside from forex traders anxiously awaiting the WTO Boeing/Airbus case ruling, there are several FOMC members scheduled to speak throughout the week. The DailyFX Economic Calendar notes that the Fed’s Charles Evans, Richard Clarida, and Michelle Bowman will be in the spotlight Tuesday at 7:15 GMT, 12:50 GMT, and 13:30 GMT respectively. Fed commentary stands to stir US Dollar currency volatility and sway USD price action if their remarks conflict with the market’s currently priced expectations for future monetary policy decisions.
Looking to hard economic data, the ISM Manufacturing PMI report is due for release at 14:00 GMT, which could underpin front-loaded FOMC rate cut bets if the headline figure remains in contraction territory and weigh negatively on the US Dollar in turn. Outside of USD specific factors like the looming WTO decision, ISM manufacturing PMI report and Fed-speak, the US Dollar could experience heightened volatility around the October RBA rate decision, Canada GDP report and Eurozone inflation, which brings AUDUSD, USDCAD and EURUSD into focus.


