
US Dollar Price Outlook: USD Primed For FOMC Minutes, Jackson Hole
US DOLLAR FINDS RESISTANCE AFTER LAST WEEK’S RECOVERY RALLY
The US Dollar is now flat for the week as a couple of key drivers on the economic calendar approach. Today at 2PM ET marks the release of FOMC minutes from the July rate decision. That was the Fed’s first rate cut in a decade, and the manner with which it came in brought a bit of confusion into the mix. While the FOMC did cut rates by 25 basis points, the bank wasn’t nearly as dovish as what markets were looking for and the net impact of that rate decision was USD-strength as the Dollar churned up to fresh two-year-highs shortly after. Will this afternoon’s release of meeting minutes show a more-dovish Fed than what was evident at the rate decision three weeks ago?
The rate cut rally in the US Dollar then led-in to the additional tariff announcement on China, which created reverberations throughout markets with US equities getting hit lower on the heels of that surprise. The Greenback dropped as well, although the fall would remain relatively brief as support came in a week later as tariffs were delayed. The currency shot-higher over the next six trading days, eventually finding resistance around the 98.37 level; and that’s what helped to hold the highs yesterday.
Taking a step back on the US Dollar chart, and the weekly highlights the continued struggle that’s taken place in DXY above the level of 98. We are now going on four months of failure around this zone as USD-bulls have been unable to leave it behind, begging the question as to whether this afternoon’s minutes release or the Jackson Hole Economic Symposium that follows will be able to give bulls the motivation they need; or whether prices simply fall back down below the 98-handle?
US DOLLAR WEEKLY PRICE CHART
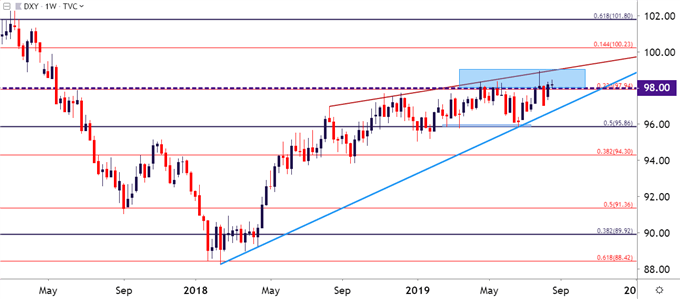
Chart prepared by James Stanley; US Dollar on Tradingview
US DOLLAR PRICE LEVELS
Given current USD price action, there are a number of levels of interest nearby. Current support is holding above the 98-handle and just a bit below that is a confluent zone of Fibonacci support that runs from 97.87-97.94. Below that, the prior yearly high of 97.70 may carry some weight, and below that, the May swing low at 97.03 remains of interest. On the resistance side of the equation, 98.37 retains some value after helping to hold the recent advance and the post-FOMC swing-high at 98.93 looms large. If this price is taken-out in the coming days, then fresh two-year-highs are in the mix, at which point target potential is directed towards 99.23 followed by the psychological level of 100.00.
It could be simple to dismiss revisits to either 100 or 97 but, as we’ve seen over the past few weeks, as these new themes around FOMC expectations get priced-in, the US Dollar can move very far, very fast. For setups on either side of the US Dollar for whichever way this scenario ends up playing out, I looked into multiple in yesterday’s webinar entitled, US Dollar Price Action Setups: EUR/USD, GBP/USD, AUD/USD, NZD/USD.
US DOLLAR EIGHT-HOUR PRICE CHART
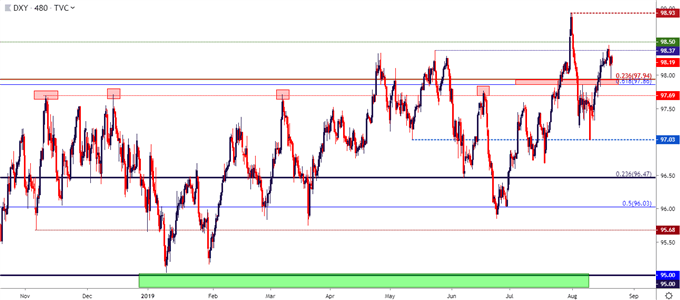
Chart prepared by James Stanley; US Dollar on Tradingview

Comments
 No Thumbs up yet!

