
US Dollar Price Outlook: EUR/USD, USD/CHF, USD/CAD, GBP/USD
We are fast approaching two very key Central Bank rate decisions with the ECB set to report on Thursday and the Federal Reserve on the economic calendar for next week. Both banks are expected to soften policy and this is already likely well priced-in to the matter; the bigger question is what each might do after that in Q4 of this year. Will the ECB talk up the prospect of QE? Will the FOMC at least acknowledge that this cut is more than a simple ‘mid-cycle adjustment?’ And what will they say about policy going into 2020? This will be the bank’s first rate decisions since the July cut which means this will be the first release of updated economic projections via the SEP since the bank began softening policy.
In the US Dollar - last week saw a gust of weakness take over in USD after the currency had rushed up to fresh two-year-highs to kick off September trade. USD price action has now snapped back for a resistance test in a very familiar zone, taken from the 98.33 April swing-high up to the 98.50 level. This zone has now held resistance in April, May, August and now September.
US DOLLAR DAILY PRICE CHART: RESISTANCE HOLDS IN A KEY ZONE
(Click on image to enlarge)
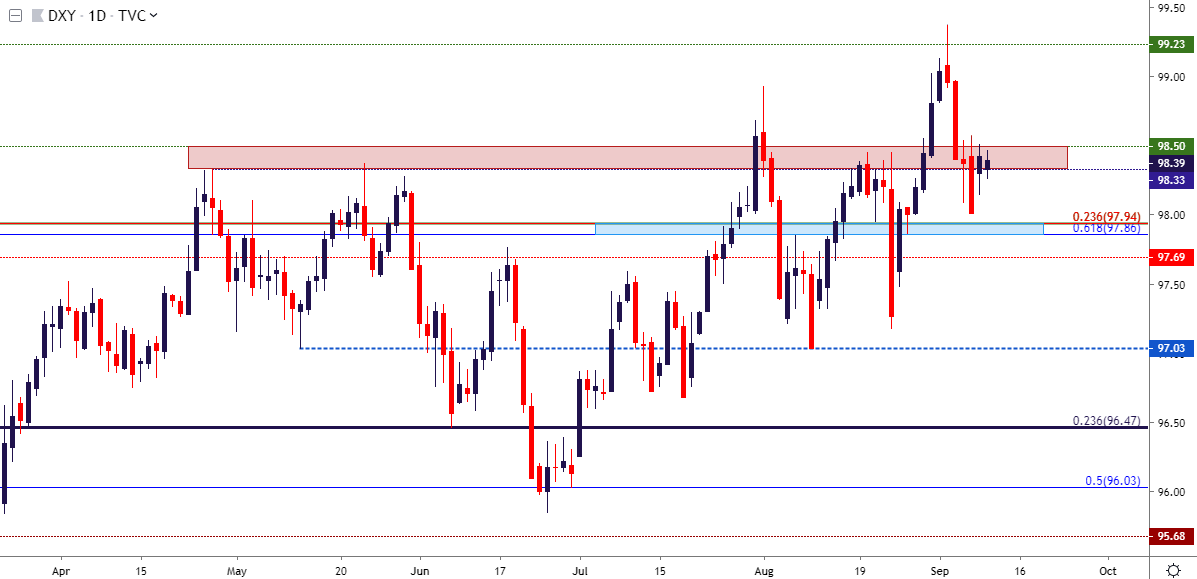
Chart prepared by James Stanley; US Dollar on Tradingview
EUR/USD BUILDS IN RANGE, DRIVERS ON BOTH SIDES
Given the outlay of ECB this week leading into FOMC next week, and naturally the attention shifts to EUR/USD. This may not necessarily be a ‘good’ thing as the pair’s price action has been in a trend-less state over the past week and it looks as though there could be a trap on either side of this scenario.
Sure, the ECB will probably cut – but that’s been long known. More pressing to the value of the single currency is whether the ECB is open to the idea of QE in the not-too-distant-future? Complicating matters is the fact that a leadership handover is in the cards for later this year with a new ECB President taking over, making it an inopportune time to trigger new programs that will take years to implement. So, there’s still the very real possibility that the Euro rips with strength on Thursday should the ECB not be dovish enough beyond this week’s rate cut.
EUR/USD FOUR-HOUR PRICE CHART: DIGESTION AHEAD OF ECB
(Click on image to enlarge)
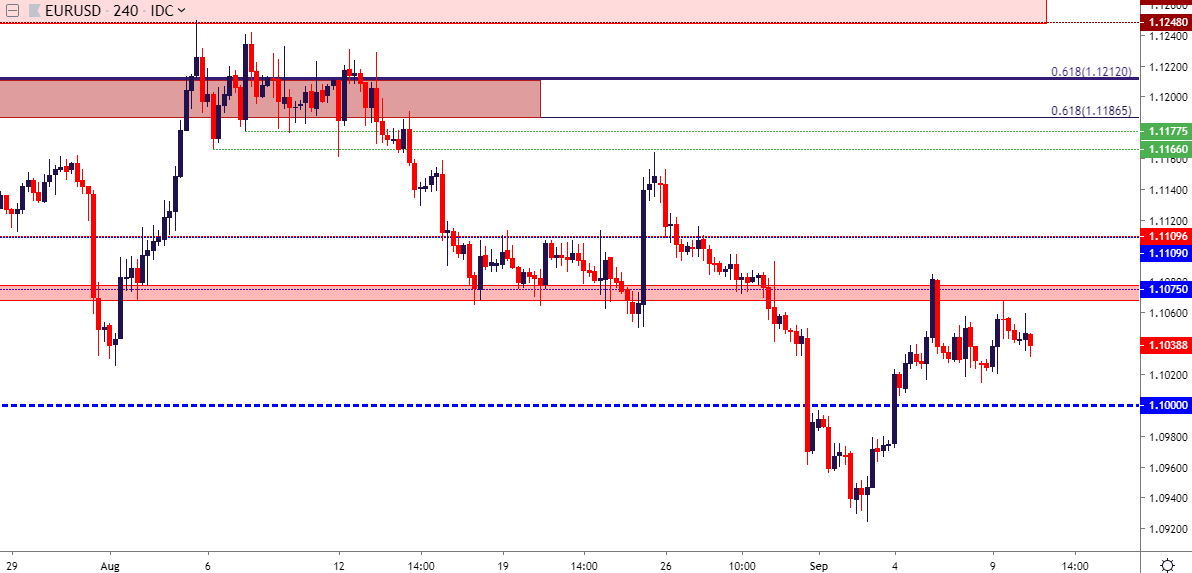
Chart prepared by James Stanley; EURUSD on Tradingview
USD/CHF CONTINUES RALLY
For the past few weeks, I’ve been focusing long-USD approaches towards USD/CHF rather than EUR/USD. While a number of questions remain around the Euro, the drive from the Swiss National Bank has been a bit clearer. The SNB wants to avoid Franc-strength and they’re willing to intervene in markets to accomplish their goal, as history has shown multiple times in the recent past.
USD/CHF temporarily traded up to fresh monthly high earlier this morning, with a short-term pullback to support at the .9902 Fibonacci level. For long-USD approaches, this will likely remain as one of the more attractive venues near-term, and the bullish construction of recent USD/CHF price action would illustrate the potential continuation of this scenario.
USD/CHF FOUR-HOUR PRICE CHART
(Click on image to enlarge)

Chart prepared by James Stanley; USDCHF on Tradingview
USD/CAD SINKS TO SUPPORT, CATCHES BID
On the short-side of the US Dollar, I’ve been following USD/CAD. The pair put in a difficult scenario in late-August as bulls and bears slugged it out to see who would take control. USD/CAD strength capitulated in the opening days of September, with resistance finally showing in the confluent zone that runs from 1.3361-1.3385, getting an assist from the under-side of a previous bullish trend-line.
USD/CAD has now traded down to the second target in the 1.3132-1.3150 zone, getting an assist from the Bank of Canada along-the-way; and selling pressure has since dried up. This can keep focus on lower-high resistance potential around the 1.3200 area on the chart.
USD/CAD EIGHT-HOUR PRICE CHART
(Click on image to enlarge)

Chart prepared by James Stanley; USDCAD on Tradingview
GBP/USD: CABLE RALLY HOLDS HIGHER-LOW SUPPORT
Also on the side of USD-weakness I’ve been following GBP/USD. The pair rode an aggressive down-trend into the month of August with a long-term trendline coming into play in the opening days of the month. That trend-line helped support to build throughout August and as USD-weakness took over last week, GBP/USD jumped aggressively despite a backdrop of seemingly negative fundamental headwinds.
As looked at last week, pullback potential remained in the pair and prices staged an early week test of the support zone looked at in last week’s webinar. This runs from 1.2233 to 1.2260 and was tested early on Monday morning.
GBP/USD FOUR-HOUR PRICE CHART
(Click on image to enlarge)
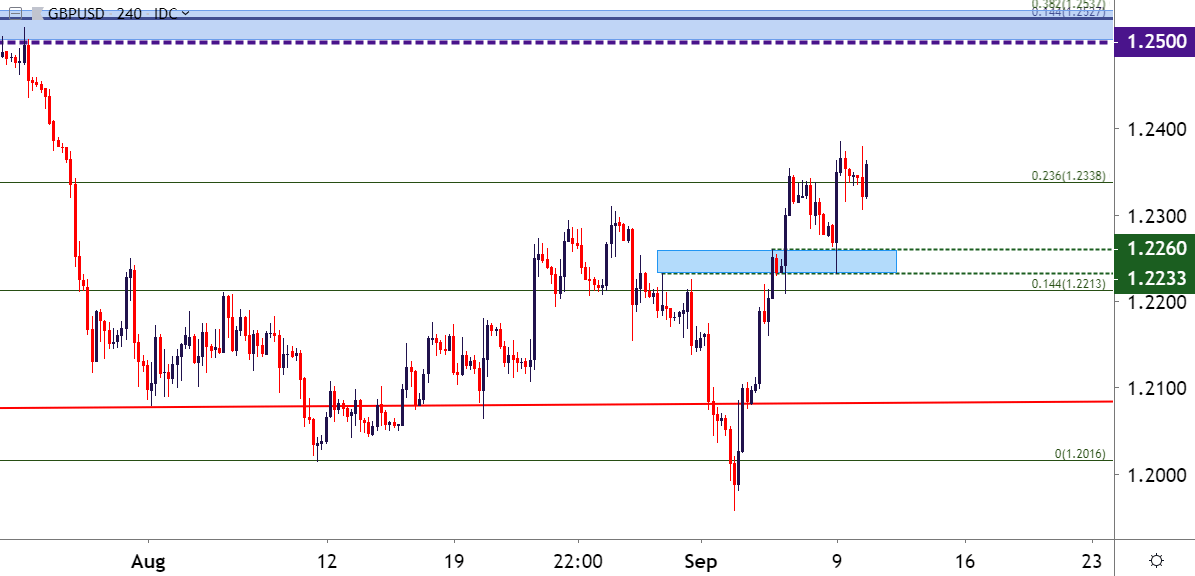
Chart prepared by James Stanley; GBPUSD on Tradingview


