
US Continues To Lead Global Equity Markets So Far In 2020
Shares in American companies dominated last year’s bull run in stock markets around the world and 2020 is a repeat performance, at least through yesterday’s close (Jan. 23).
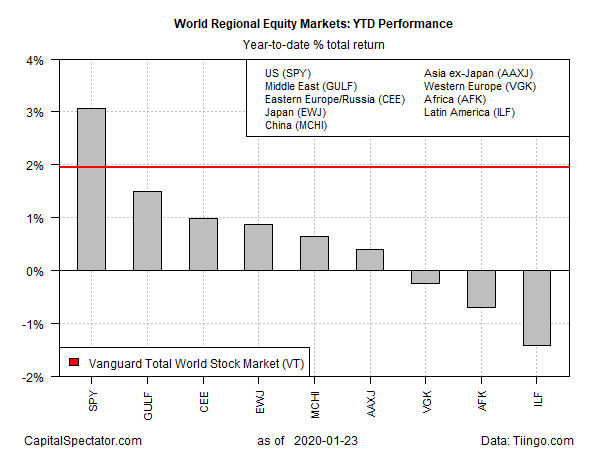
In the kick-off to the new year, US equities remain well ahead of the other main slices of global market regions, based on a set of exchange-traded products. The upside outlier at the moment: SPDR S&P 500 (SPY), the most popular US benchmark. Year to date, SPY is up 3.1%. Extending the fund’s virtually non-stop rally in last year’s fourth quarter, SPY has enjoyed a mostly smooth rise in 2020 to date.

Note that the second-best performer this year is the global benchmark. World equities are higher by 2.0% through yesterday’s close, based on Vanguard Total World Stock (VT). The strong run for VT provides support to comments from Ray Dalio (founder of investment firm Bridgewater Associates) earlier this week, when he said that “cash is trash.” For now, the broad trend in equities agrees.
The exceptions to a largely bullish run in 2020 can be found in Western Europe, Africa and Latin America. Funds representing each of those regions are currently posting modest losses this year. The deepest setback: iShares Latin America 40 (ILF), which is down 1.4% year to date.
Despite a bit of red ink in some corners of global equity markets, a bullish aura continues to prevail. Bloomberg reports that “while investors remain cautious with global stocks trading close to all-time highs, corporate earnings are topping expectations and slew of data this month has validated forecasts for a recovery in the global economy.”
China’s virus outbreak is worrisome, raising questions about how or if this risk factor could impact the global economy and markets. But for now, investor sentiment is largely downplaying the potential for blowback.
“It’s going to depend on how China continues to be transparent with the international community,” advises Peter Levesque, managing director of Modern Terminals, which operates ports in Hong Kong. “That’s all business can ask for. The rest is unknown.”
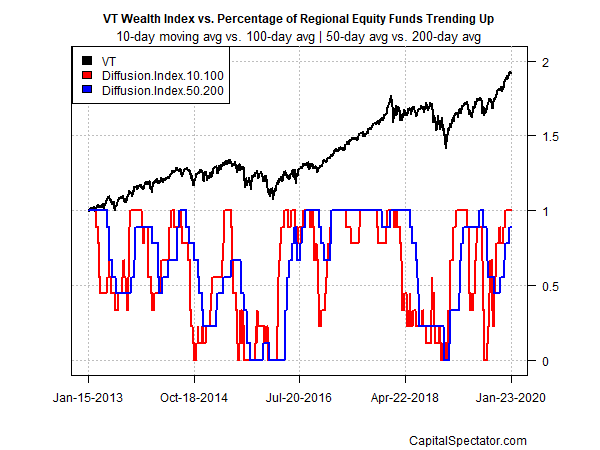
Meanwhile, a mostly bullish trend rolls on, based on a momentum profile for the funds listed above. The analysis is based on two sets of moving averages, which point to a broad-based upside bias overall for global shares. The first measure compares the 10-day average with its 100-day counterpart — a proxy for short-term trending behavior (red line in chart below). A second set of moving averages (50 and 200 days) represent an intermediate measure of the trend (blue line). Based on current data through yesterday’s close, the majority of funds are trending positive.
Disclosure: None.


