
Two Yield Spreads Are Better Than One For Business Cycle Analysis
The US recession warnings are flying every which way lately in the wake of an inverted yield curve. The spread on the 10-year less 3-month yields, in particular, has unleashed a wave of predictions that a new downturn is near. But some analysts point out that another widely followed spread — 10-year less 2-year yields – is still positive, albeit modestly so. What’s an informed investor to do? Wait for both spreads to confirm a recession forecast before betting the farm on contraction.
To be clear, The Capital Spectator recommends looking beyond yield curves in search of reliable, timely signals on US recessions. On that basis, recent data indicate that an NBER-defined downturn hasn’t started and isn’t likely to start in the immediate future, as discussed in last month’s profile of business cycle risk. (For a more comprehensive review of the macro trend with weekly updates, see The US Business Cycle Risk Report.)
The Treasury yield curve is part of the mix for evaluating the business cycle, but relying on it in isolation, despite an encouraging track record, is ill-advised. Why? Because any single indicator is prone to false signals, even if history suggests otherwise. Economies evolve and investors adapt to history’s lessons, which implies that nothing’s written in stone when it comes to reading the tea leaves of the business cycle through time. Reviewing a broad data set can help minimize the risk of being led astray with an overly narrow focus on the economic and financial numbers.
But to the extent that we look to the Treasury yield curve for insight, should we favor a particular maturity? More to the point, is the 10-year/2-year spread superior to the 10-year/3-month spread? In fact, history implies that using both spreads is an improvement over one or the other.
Consider the last three recessions, when both spreads went negative ahead of each contraction. By comparison, the two spreads are in conflict at the moment, based on rates as of yesterday (June 4) via daily data published by Treasury.gov.
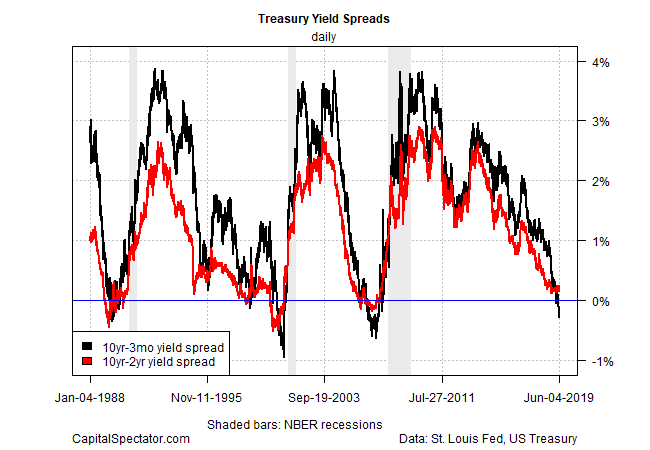
The 10-year/3-month spread is negative at 23 basis points under zero (black line in chart above). The slide marks the eighth straight day of below-zero readings.
The 10-year/2-year spread (red line), on the other hand, remains positive, if only mildly so. As of yesterday, this gap was positive at 24 basis points.
Until the 10-year/2-year spread falls below zero, it’s reasonable to reserve judgment on the recession outlook. If the 10-year/2-year spread succumbs to financial gravity, however, the case will strengthen considerably for arguing that the Treasury curve is pricing in a high probability of recession.
Alternatively, if the 10-year/3-month spread pops above zero at some point, it’ll be easier to argue that its brief trip into sub-zero terrain was noise.
Keep in mind that the two spreads reflect different aspects of the bond market. That’s a function of how the market perceives the maturities at the low end of these spreads.
The 2-year rate is considered a measure of the crowd’s expectations for Federal Reserve policy. Meanwhile, the 3-month yield is a proxy for the “risk-free” rate of cash.
Although both yields are sensitive to all the usual suspects, including changes in Federal Reserve policy, subtle differences in how the market treats these rates can, at times, be meaningful. In turn, looking to both yield curves for assessing the market’s outlook for recession risk offers an improvement to looking to either one in isolation.
As always, there’s still no guarantee that the financial markets will dispense flawless forecasts. But in pursuit of high confidence and less noise, two is better than one for dissecting yield curves in search of high(er) probability estimates of the economic expansion’s health.
Disclosure: None.


