
Two Metals And An Interest Rate
No doubt about it. It’s been a good year for gold. Bullion prices have climbed 29 percent over the past 12 months. However, the same can’t be said for gold’s Comex stablemate, copper. While today’s price for the red metal is virtually the same as it was a year ago, its pathway has been decidedly more perilous. Copper’s only now recovering from a 20% plunge induced by the coronavirus pandemic. But it’s that very bounce that’s attracted the attention of speculators and economic pundits.
Over the years, copper’s earned a reputation as a bellwether of boom and bust cycles, rightly or wrongly. There’s a pervasive optimism driving copper prices now as the nation emerges from shutdown. Copper is an industrial metal with more than two-thirds of world supply going into building construction and electronics. The metal fares well when demand is high and that’s usually when the economy’s in high gear.
No wonder it’s now being weighed as a momentum play. On a technical basis, the potential upside for the red metal is actually better than gold’s (23% vs. 19%, respectively).
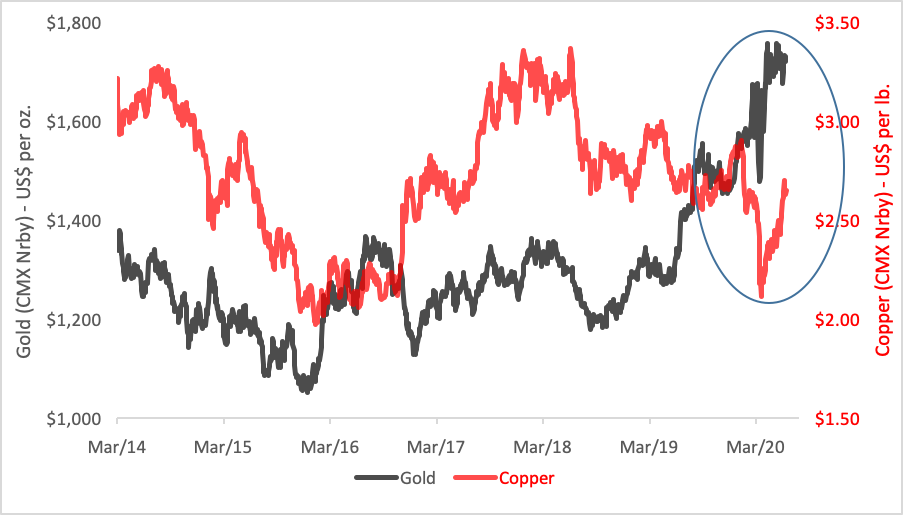
Gold’s price is influenced more by interest rates and inflation expectations rather than shifts in production and consumption. There just isn’t the same supply-demand dynamic at work on bullion as there is with copper. Most of the world’s gold supply simply gets stored and transferred from one vault to another.
Gold, above all, is a safe haven asset, hoarded in times of economic distress and upheaval. In a sense, gold is a barometer of fear; copper’s price measures economic optimism, quite the opposite.
Over the long term, the two metals tend to move in the same direction but, every once in a while, they diverge. Those excursions, as we shall see, are telling. The copper market, too, tends to be more volatile than gold, implying a greater sensitivity to fundamental trends.
That said, appreciating the interplay of the two metals’ price trajectories bestows powerful juju to market forecasts. The relationship is best displayed in the copper/gold ratio. Tracking copper’s price in gold terms reveals a lot about investor sentiment. The ratio rises as confidence in the economy grows and declines as prospects sour.
The utility of the copper/gold ratio can be better appreciated by plotting it against the 10-year Treasury note yield. Notice, in the chart below, how closely the adjusted (x 1,000) ratio tracks the note’s rate. The correlation has been 0.83 over the past six years but similar coefficients have held for several more years in the past.
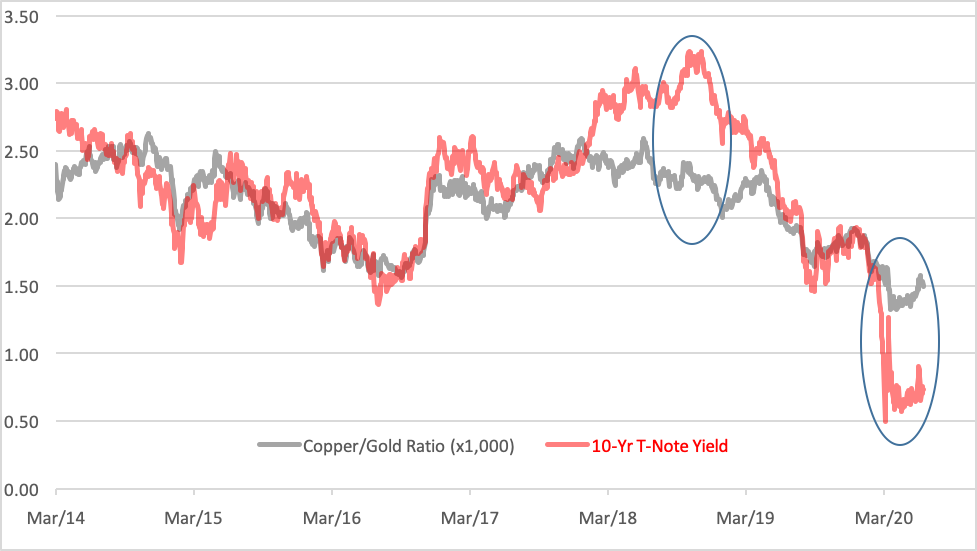
You’ll notice that the spread between the ratio and the T-note yield sometimes widens. Two incidents, in particular, are notable over the past two years. In 2018, the 10-year yield spiked above the copper/gold ratio, eventually peaking with a double-top in October-November. In its wake, the T-note yield slid 170 basis points, dragging the copper/gold ratio southward along with it. And now we see the reverse where the note yield has swung to a deep discount.
Clearly, the note yield is the more volatile metric. One-and-a-half times more capricious than the copper/gold ratio, in fact. That volatility, expressed as overshoots in the note rate, signals turning points in the yield’s trajectory.
Just as the 2018 double-top and wide gap heralded a precipitous decline in interest rates, the current downside gap and bottoming action seems to be pointing to higher yields and higher copper prices to come. If, indeed, the copper/gold ratio swings to the upside, copper should start outperforming bullion.
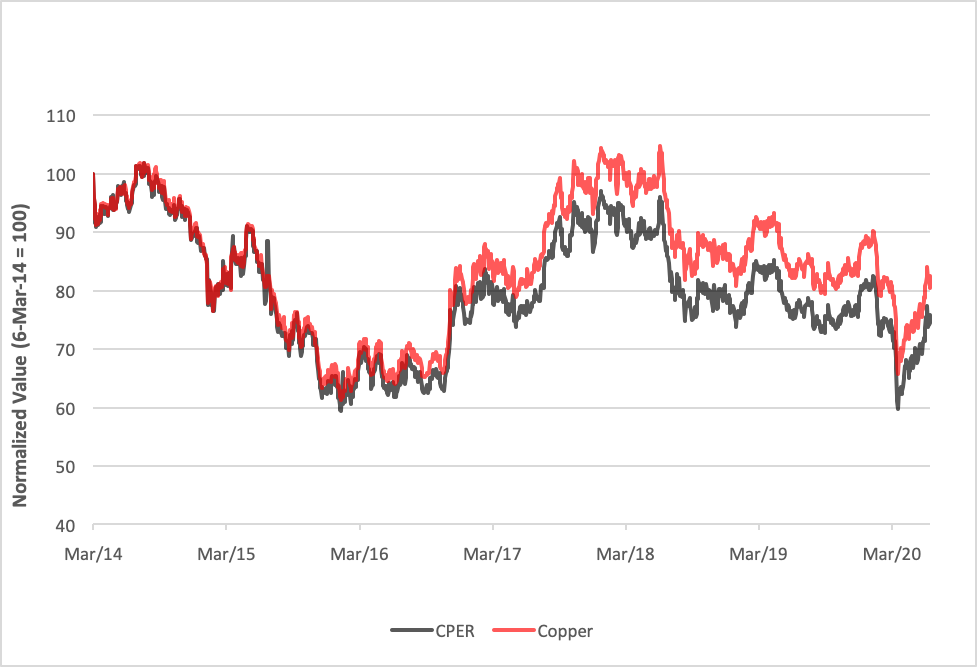
The foregoing suggests two plays. The more straightforward is long copper. The United States Copper Index Fund (NYSE Arca: CPER), an exchange-traded commodity pool tracking Comex copper futures, uses an optimization algorithm to lessen contango’s impact on the fund’s returns. Still, contango’s deleterious effect is merely mitigated, not eliminated. Over the past six years, contango’s chipped away more than 5% of copper’s cumulative return.
Alternatively, the interest rate side can be played with the ProShares Short 7-10 Treasury (NYSE Arca: TBX), an ETF offering inverse exposure (-100 percent) to the daily performance of the ICE U.S. Treasury 7-10 Year Bond Index. TBX appreciates as rates rise, but investors need to monitor the fund closely as the compounding of daily returns can produce unanticipated results--both good and bad. Consensus calls for the 10-year Treasury yield to rise by 44 basis points to 1.14 percent over the next five months.
No matter what course investors take—copper or bonds—momentum is clearly building for a recovery. We’ll soon find out if that optimism is justified.
Disclosure: None.


Great points well researched, Thank you!
Nice research and grafics. Thanks for sharing.