
Trends In Oil Supply And Demand
Here I review key trends in the oil market over the last decade.

World field production of crude oil, in thousands of barrels per day, monthly Jan 1973 to Nov 2015. Excludes natural gas liquids, biofuels, and refinery processing gain. Blue line segment connects June 2005 and June 2013. Data source: EIA Monthly Energy Review, Table 11.1b.
World oil production barely increased between 2005 and 2013. Yet this was a period when oil consumption from the emerging economies was growing rapidly. For example, Chinese imports of crude oil grew by a million barrels a day between 2005 and 2008 and increased by another two million barrels a day between 2008 and 2013.
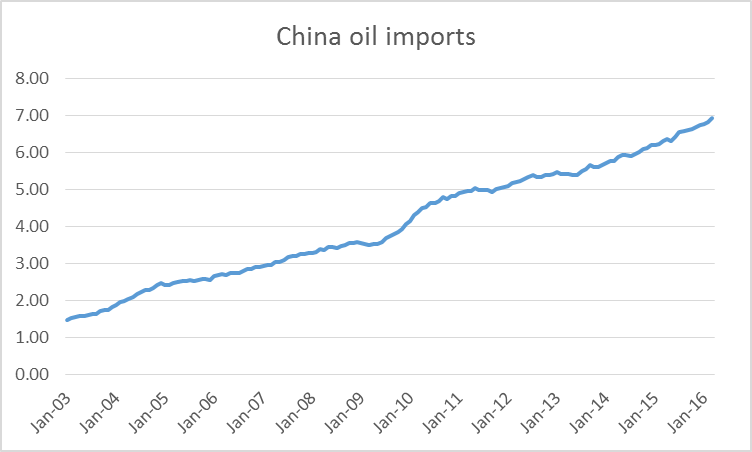
Chinese oil imports in millions of barrels a day, average over the previous 12 months, Jan 2003 to March 2016. Data source: JODI.
How could China realize such a big increase in consumption when very little additional oil was being produced worldwide? The answer is that consumption in places like the United States, Europe, and Japan had to fall. The primary factor that persuaded people in those countries to use less was the high average price of oil over 2007-2013.
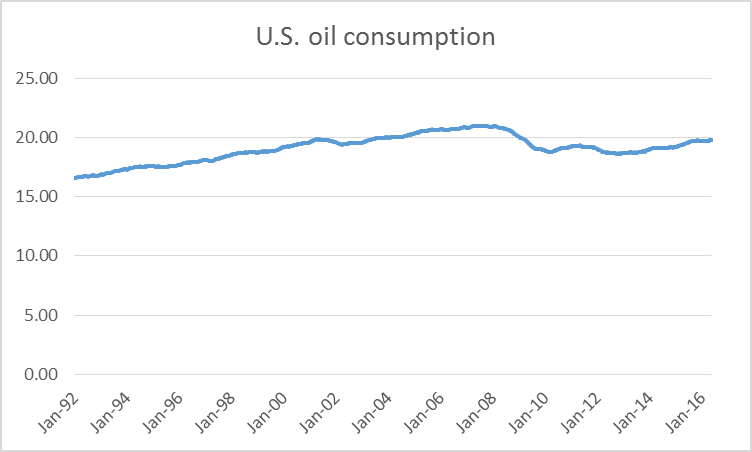
U.S. product supplied of petroleum products in millions of barrels per day, average over the previous 52 weeks, Jan 3, 1992 to May 20, 2016. Data source: EIA.
But in the last few years global oil production broke away dramatically from that decade-long plateau. In 2013-2014 the key factor was surging production from U.S. shale formations. That peaked and began to decline in 2015. But world production continued to grow during 2015 thanks to tremendous increases from Iraq. And increases in 2016 may come from new Iranian production now that sanctions have been lifted.

Iraqi field production of crude oil, in thousands of barrels per day, monthly Jan 1973 to Nov 2015. Data source: EIA Monthly Energy Review, Table 11.1a.
The new supplies from the U.S., Iraq, and Iran brought prices down dramatically. And in response, demand has been climbing back up. U.S. consumption over the last 12 months was 800,000 b/d higher than in 2013, a 4% increase. Vehicle miles traveled in the U.S. are up 6% over the last two years.
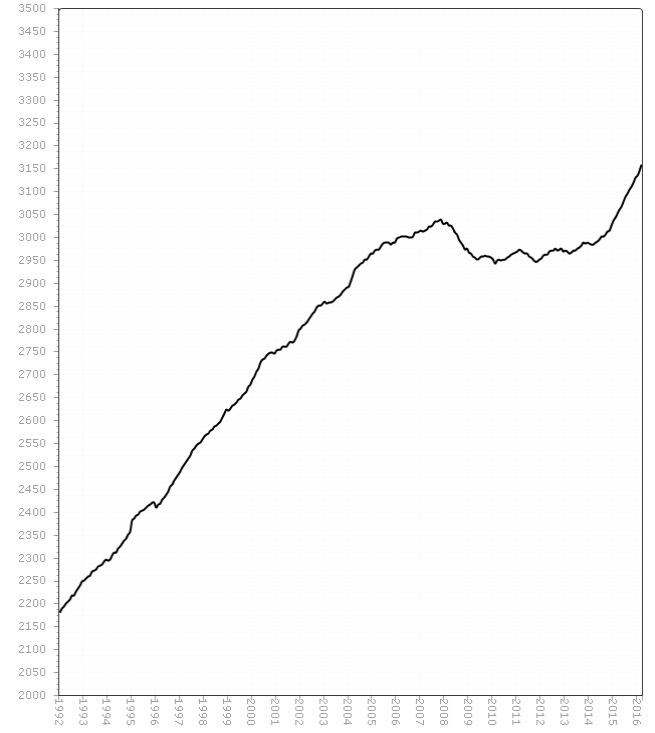
Average monthly U.S. vehicle distance traveled over the 12 months ended at each indicated date, in billions of miles, Jan 1992 to March 2016. Source: Federal Highway Administration.
Average fuel economy of new vehicles sold in the United States is no longer improving.
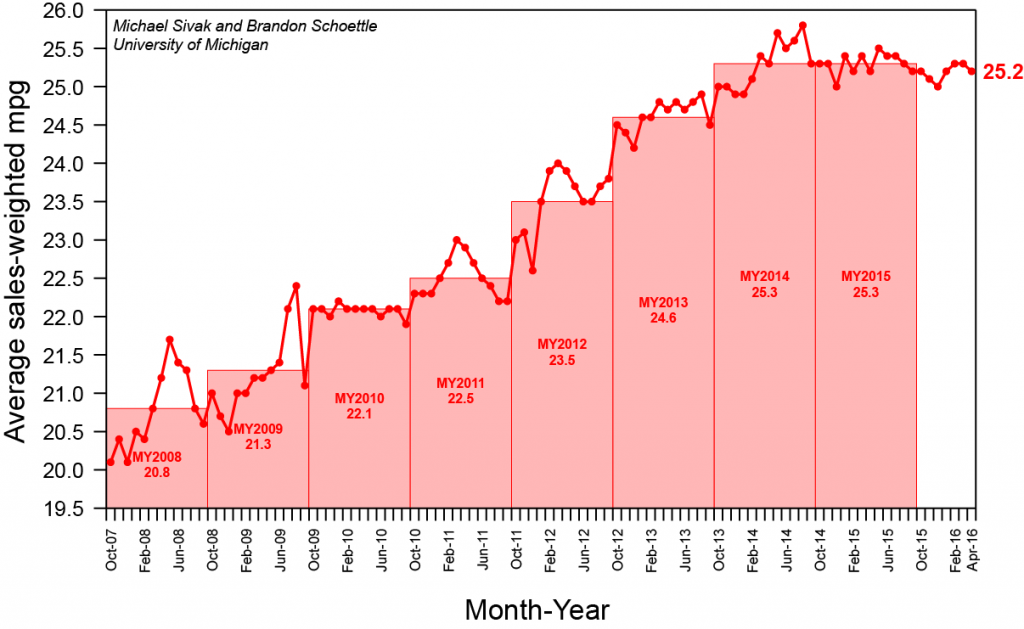
Average miles per gallon of new U.S. vehicles sold. Source: University of Michigan Transportation Research Institute.
Low prices are increasing demand and will also dramatically reduce supply. The EIA is estimating that U.S. production from shale formations is down almost a million barrels a day from last year.
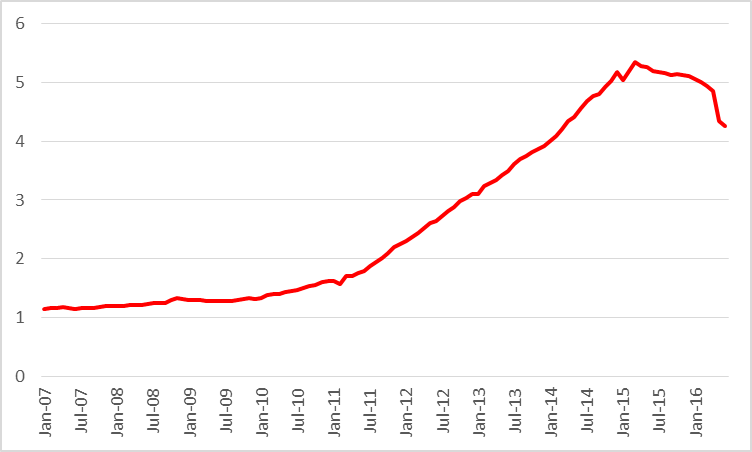
Actual or expected average daily production (in million barrels per day) from counties associated with the Permian, Eagle Ford, Bakken, and Niobrara plays, monthly Jan 2007 to June 2016. Data source: EIA Drilling Productivity Report.
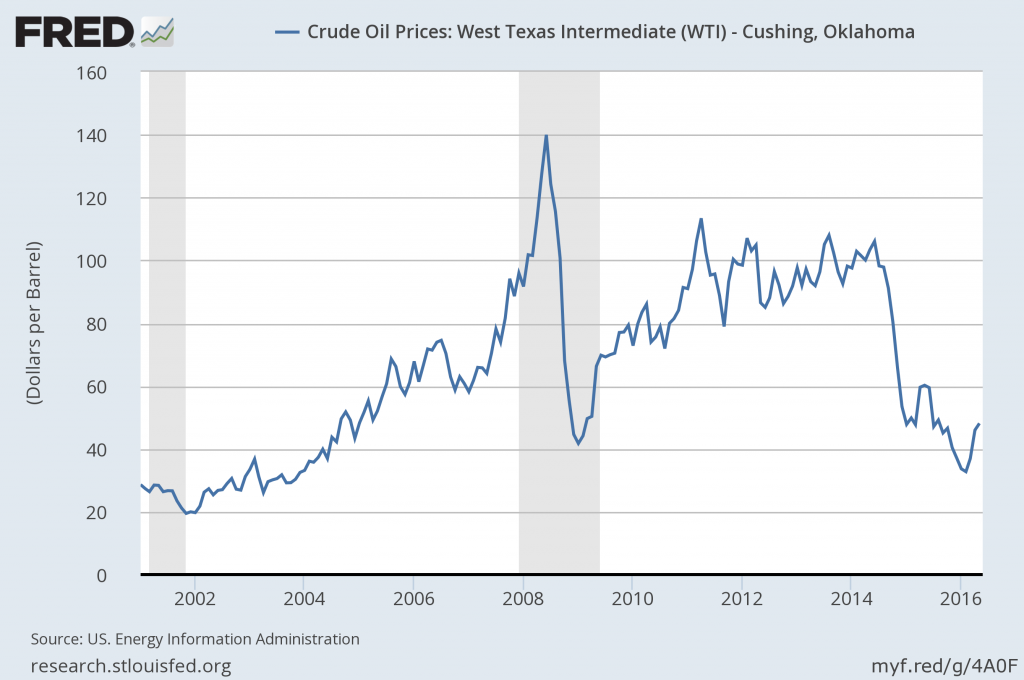
These factors all contributed to a rebound in the price of oil, which traded below $30/barrel at the start of this year but is now back close to $50.
Nevertheless, I doubt that $50 is high enough to reverse the decline in U.S. shale production. Nor is the slashing that we’ve seen in longer-term oil-producing projects about to be undone. And while there is enough geopolitical stability at the moment in places like Iraq and Iran to sustain significantly higher levels of production than we saw in 2013, there is no shortage of news elsewhere in the world that could develop into important new disruptions. For example, conflict in Nigeria may cut that country’s oil production by a million barrels a day.
Adding a million barrels/day to U.S. oil demand and subtracting 2 million b/d from U.S. and Nigerian supply would seem to go a long way toward erasing that glut in oil supply that we’ve been hearing about.
Disclosure: None.


