Trade Deficit Falls Due To Weak Consumer

Current Trends
The November Trade Deficit saw the first contraction in 4 months and actually fell to the lowest level since October 2020. This was primarily driven by a collapse in Imported Goods as shown below.
(Click on the images to enlarge)
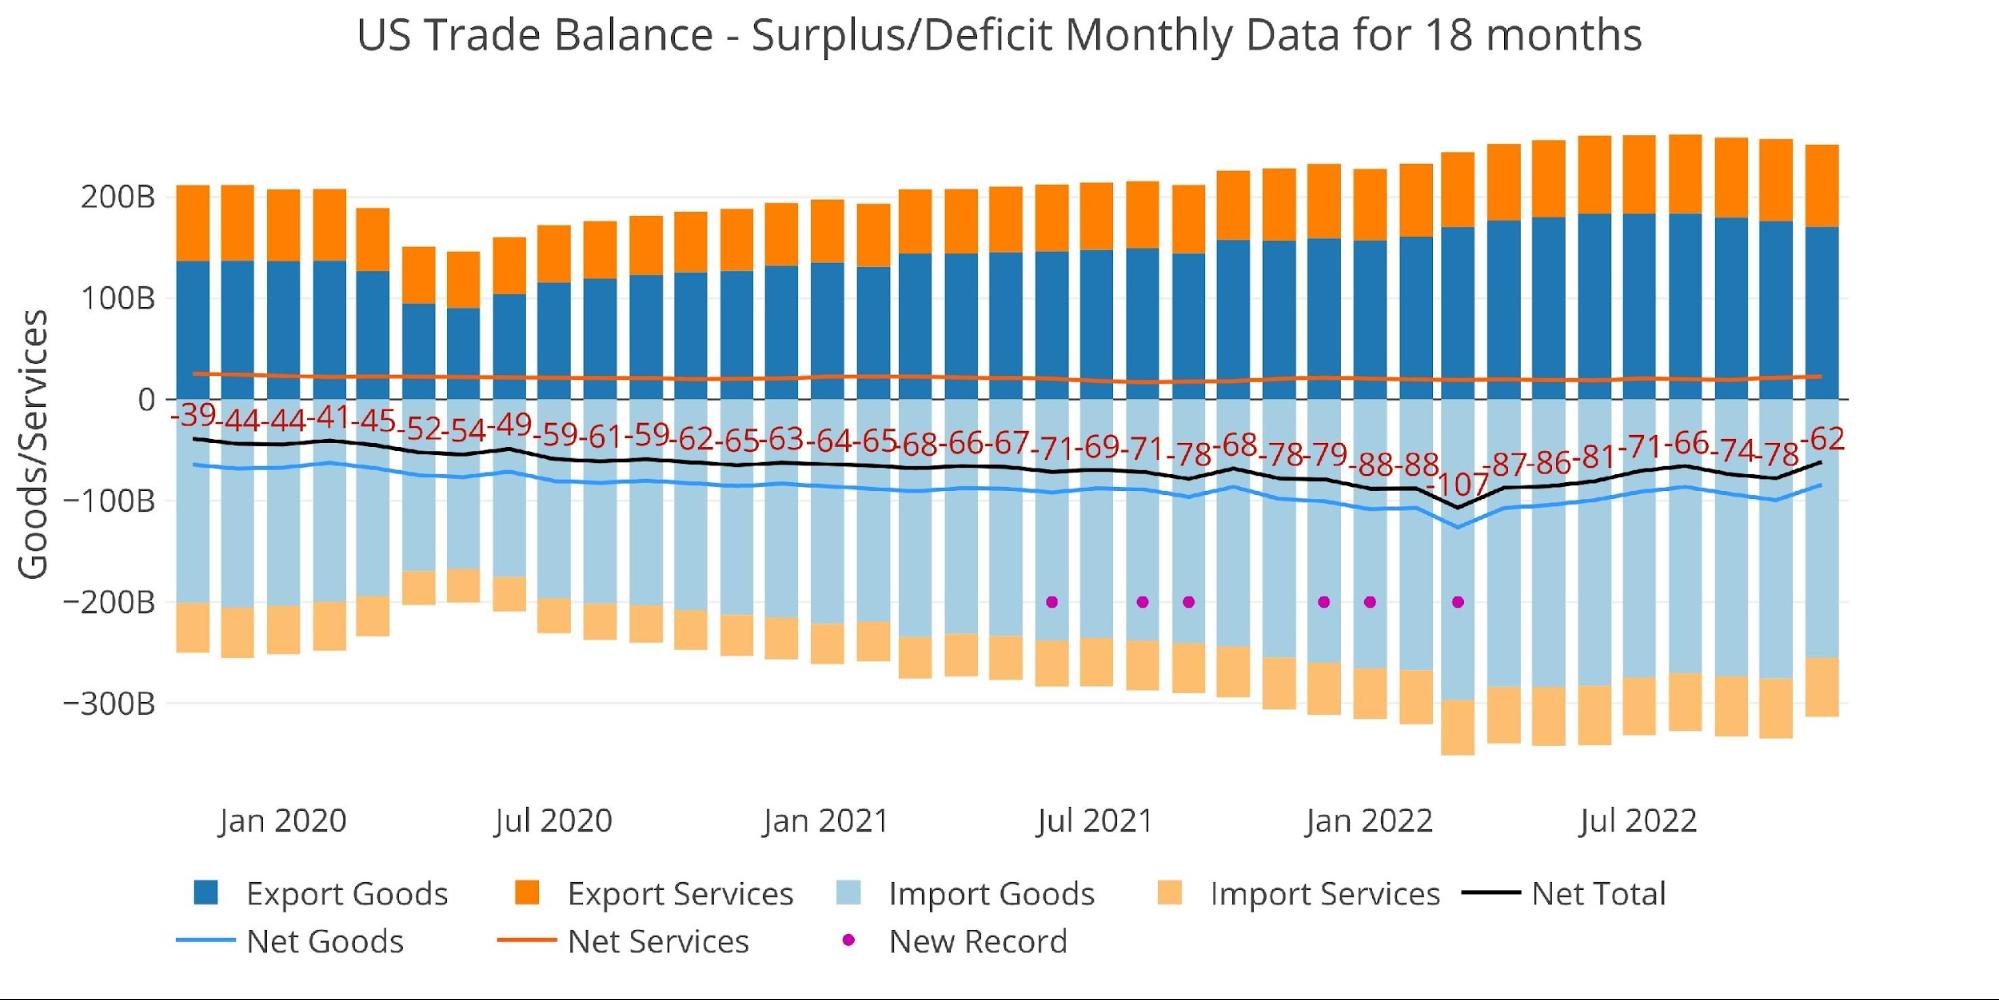
Figure: 1 Monthly Plot Detail
The table below provides detail.
Monthly Trade Deficit
-
- MoM Imported Goods crashed by 7.5%
-
- Exported Goods fell 3%
- Imported Services fell 1.3%
- Exported Services saw a slight increase of 0.3%
-
- On a net basis, the Goods Deficit fell 15.4%
- The Services Surplus increased 4.6%
- MoM Imported Goods crashed by 7.5%
Looking at Trailing Twelve Month:
-
- The TTM Net Deficit contracted MoM but is still up 16.5% since last year
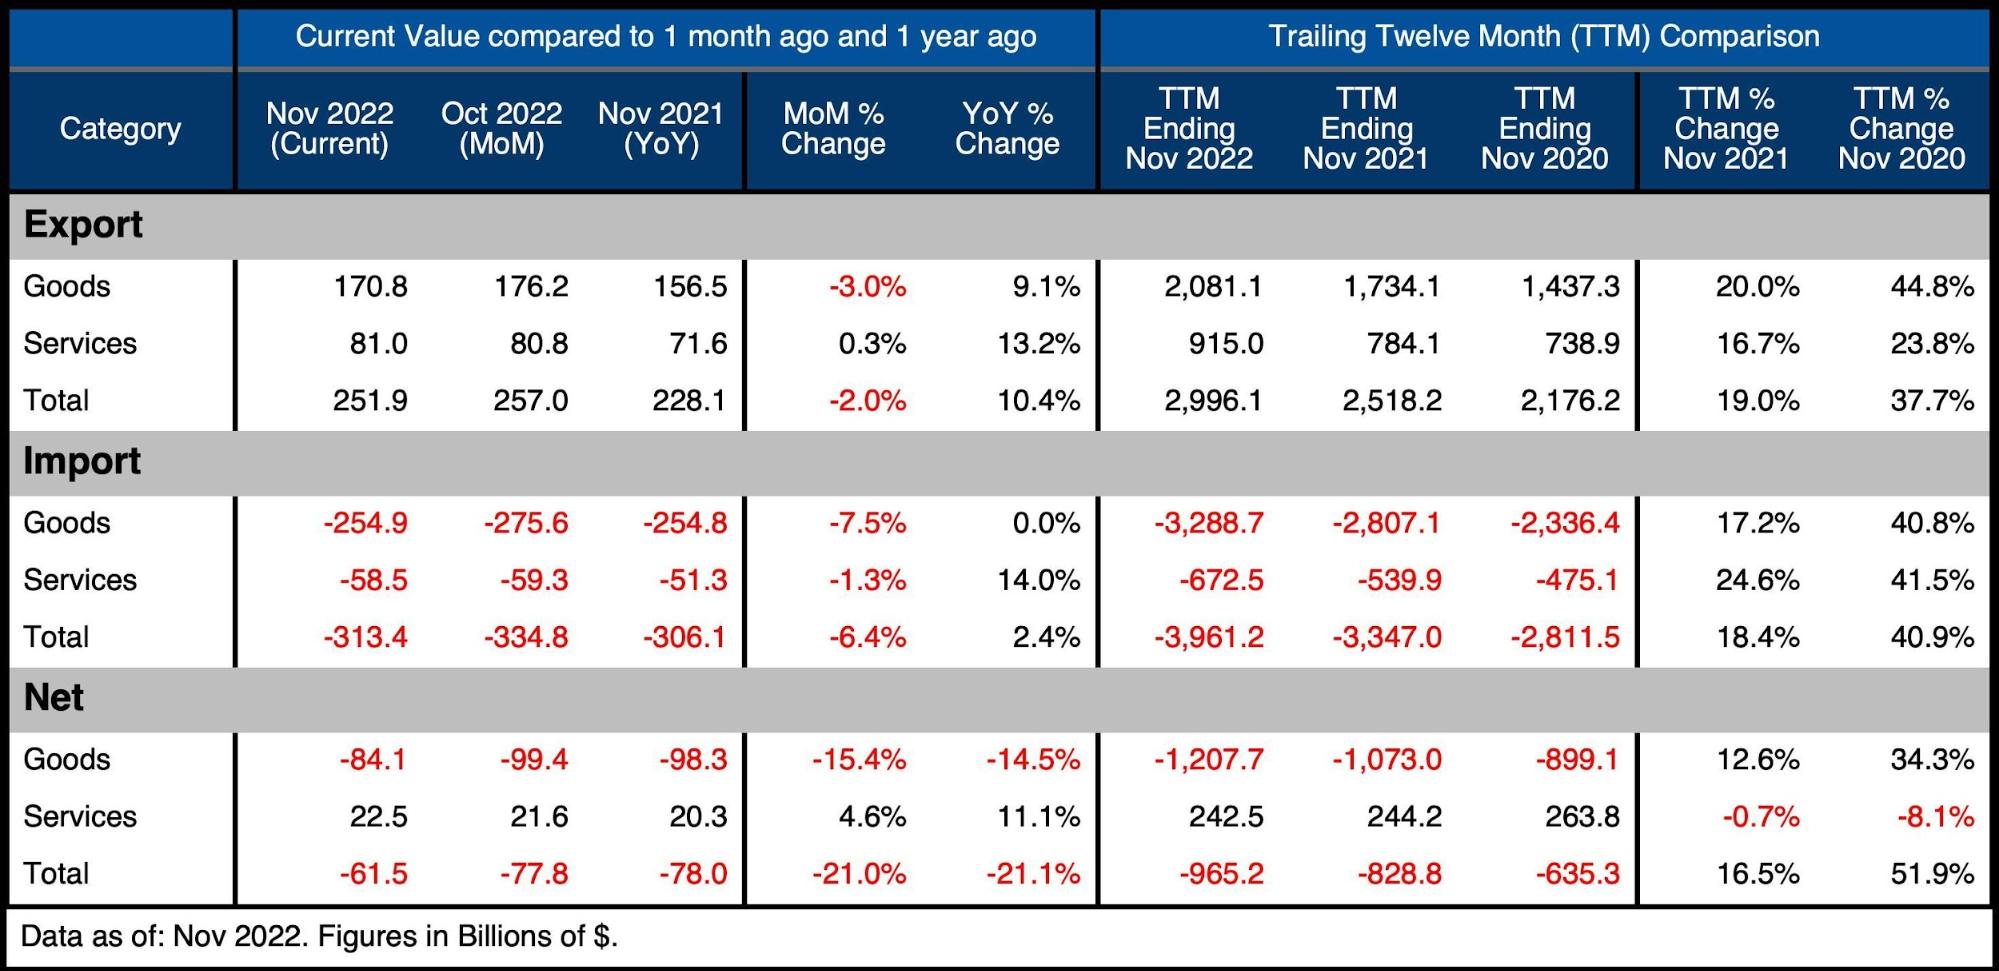
Figure: 2 Trade Balance Detail
Historical Perspective
Zooming out and focusing on the net numbers shows the longer-term trend. The massive Deficit down-spike in March fully reversed and has continued reversing sharply in the latest month after a brief hiatus.
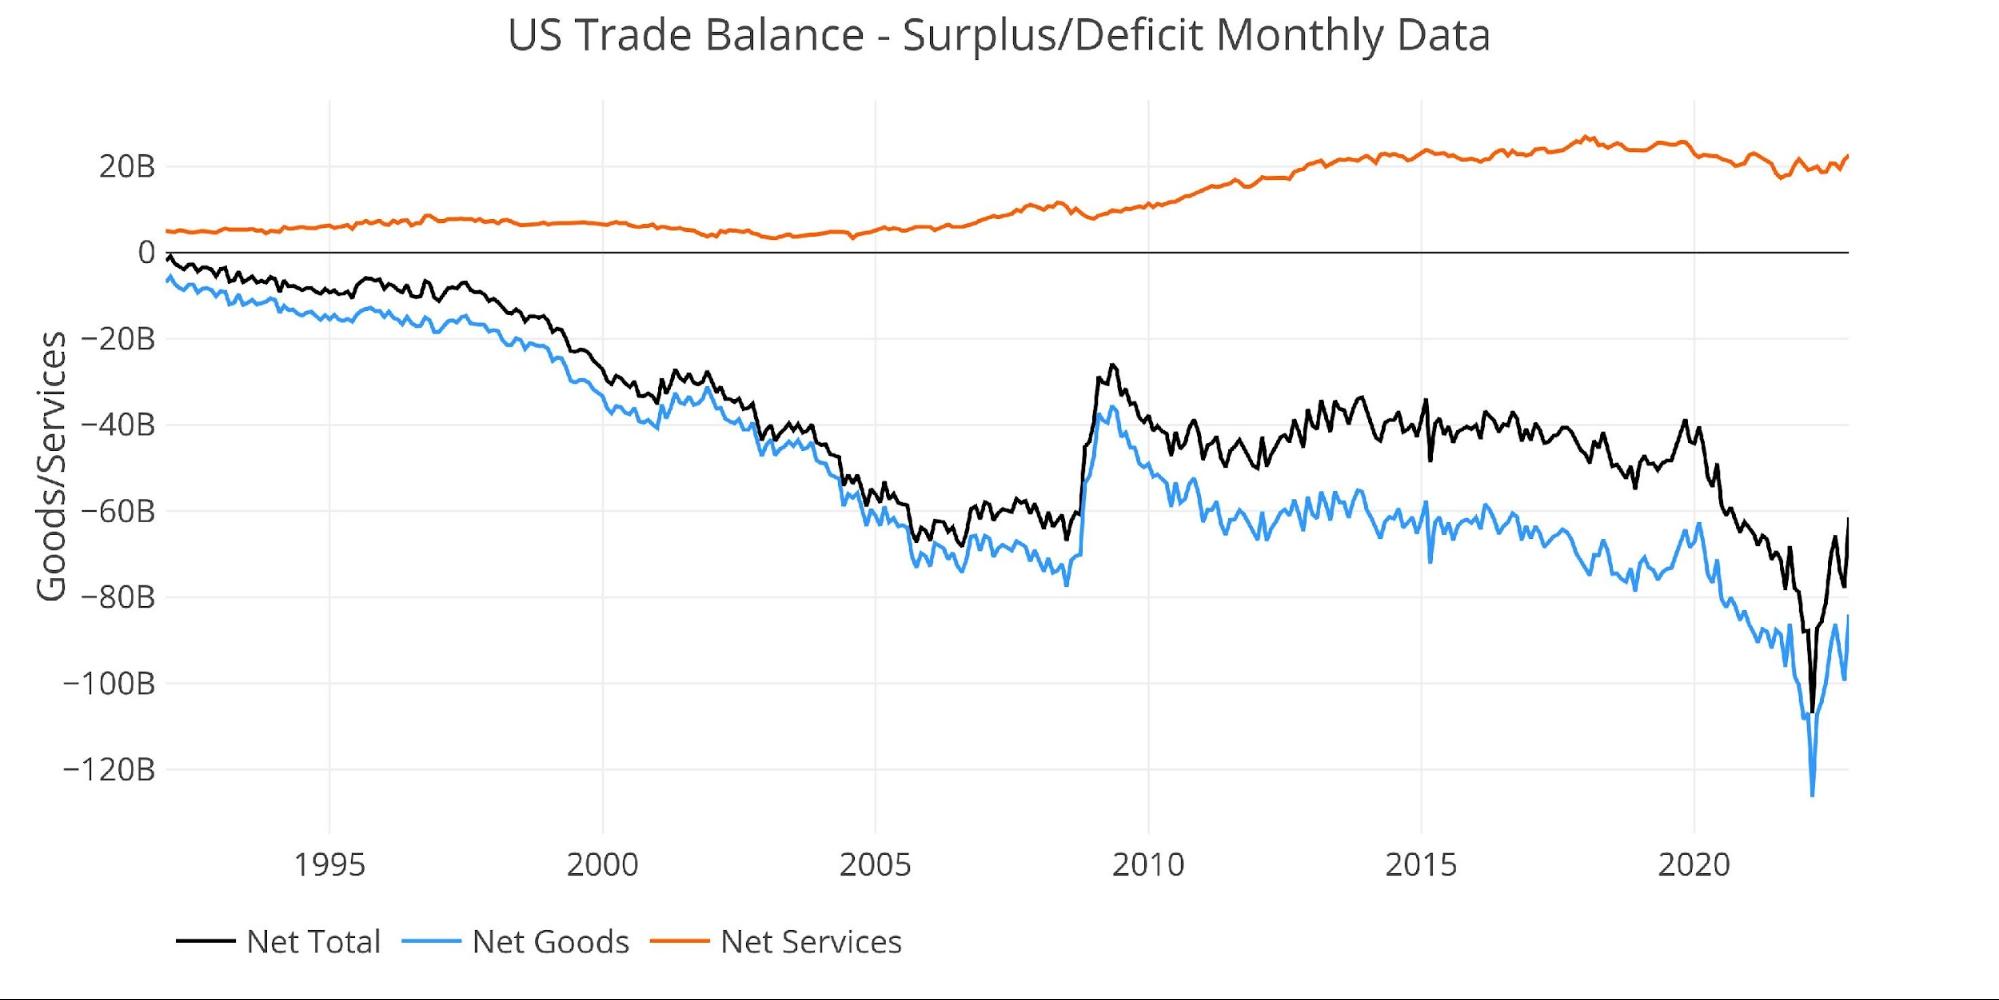
Figure: 3 Historical Net Trade Balance
The chart below zooms in on the Services Surplus to show the wild ride it has been on in recent months. It compares Net Services to Total Exported Services to show relative size. After hovering near 35% since 2013, it dropped below 30% in July last year. It now sits at 27.8%, an increase from last month due to the combined increase in exports and fall in imports.
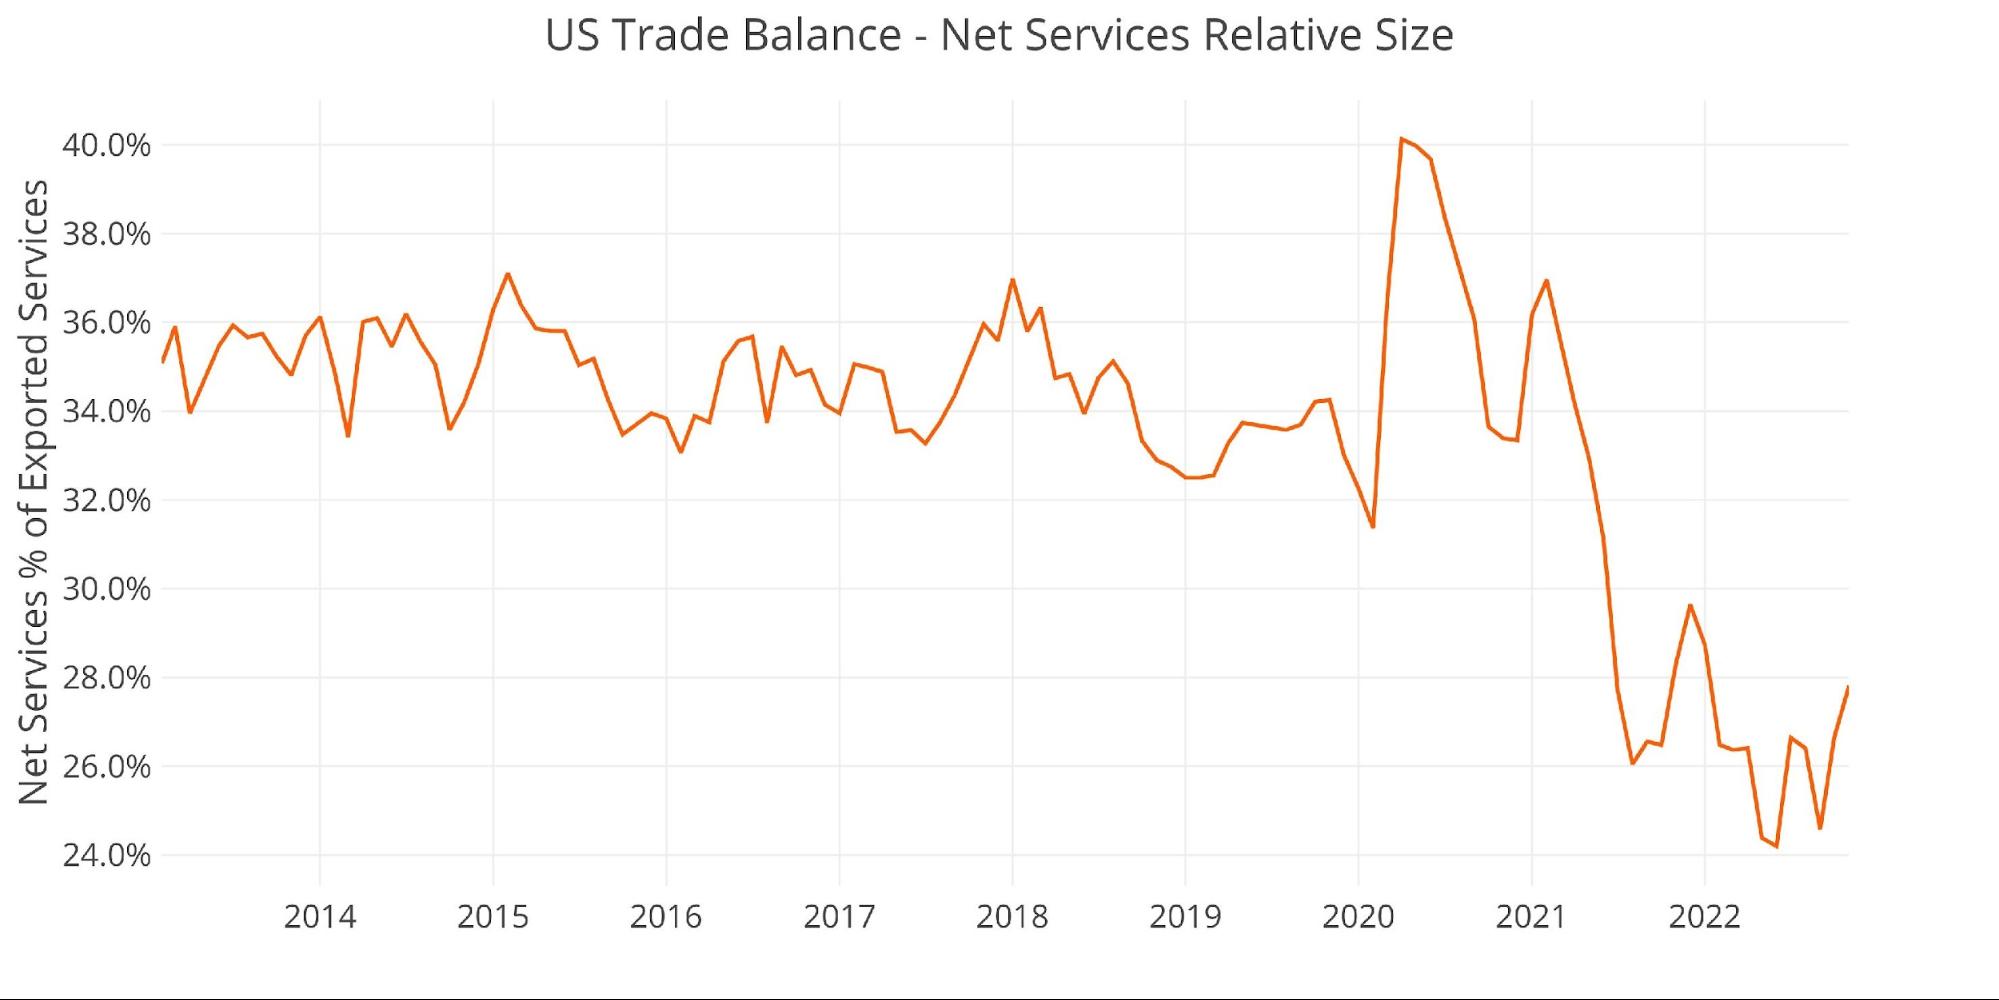
Figure: 4 Historical Services Surplus
To put it all together and remove some of the noise, the next plot below shows the Trailing Twelve Month (TTM) values for each month (i.e., each period represents the summation of the previous 12 months).
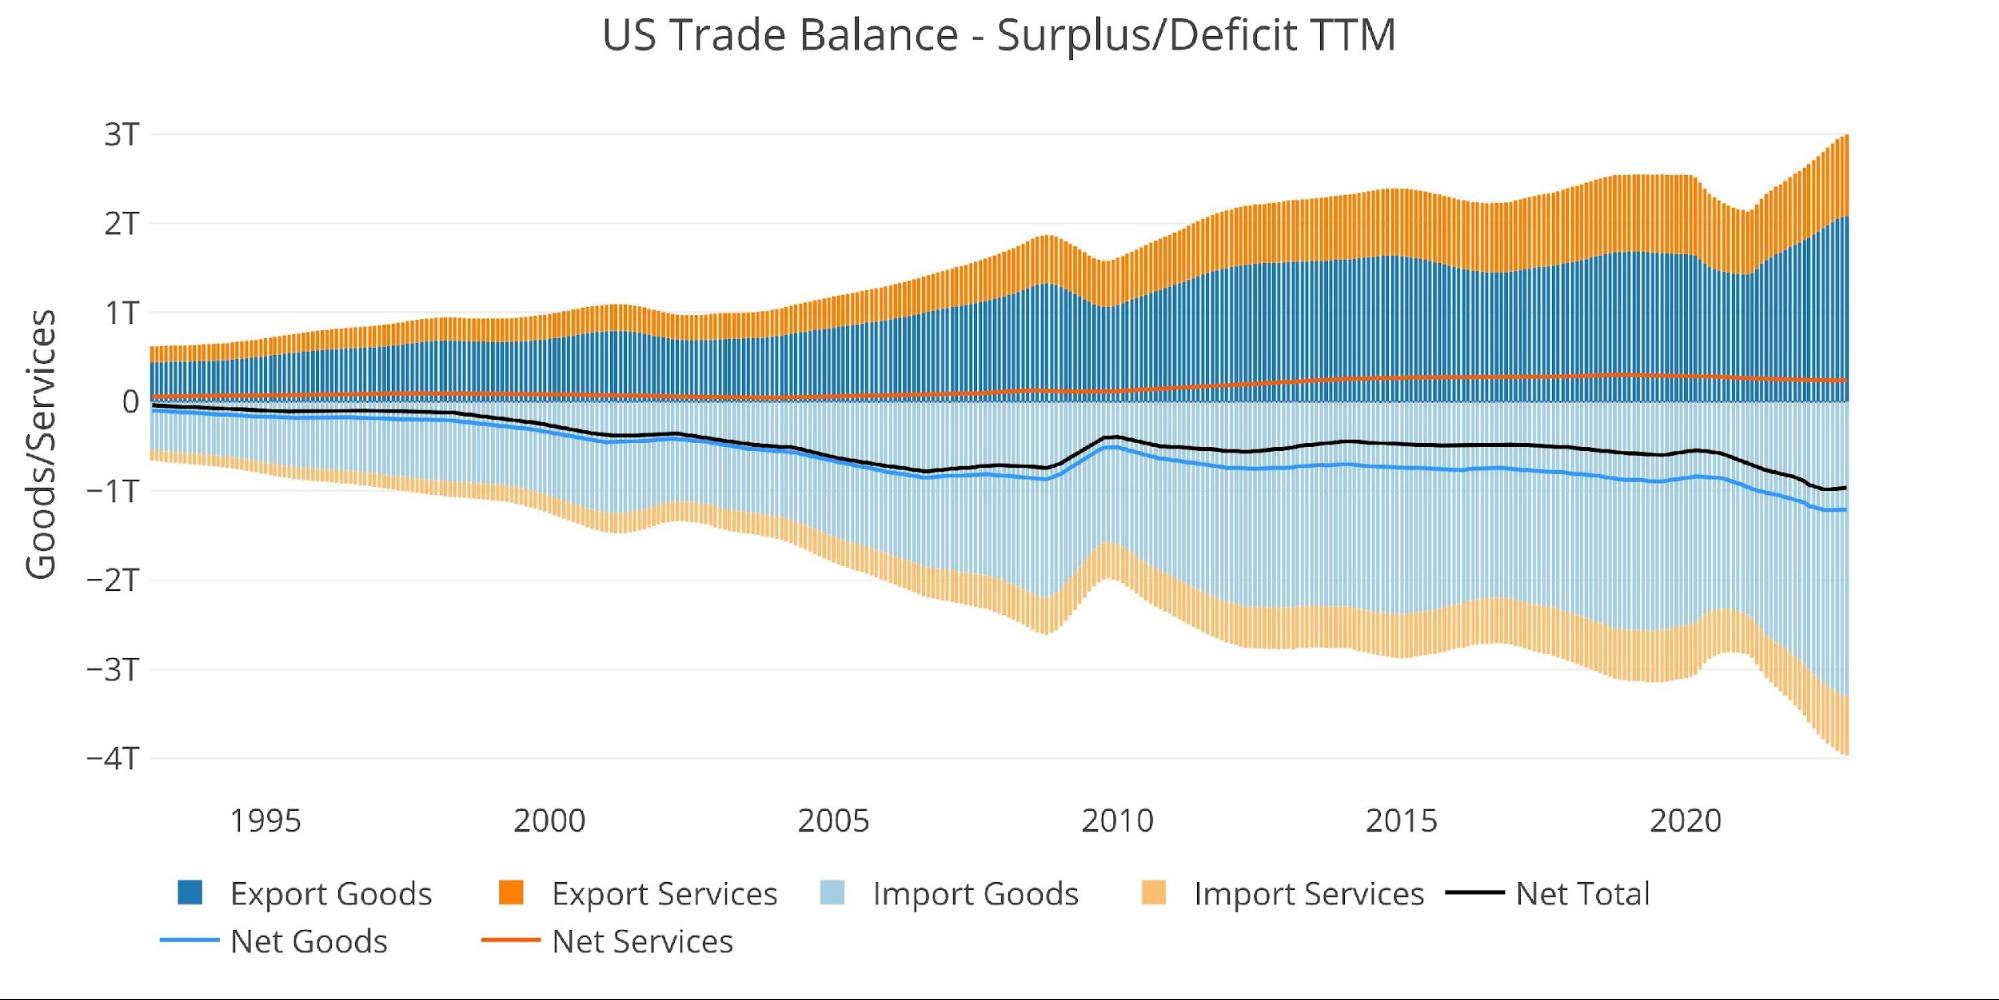
Figure: 5 Trailing 12 Months (TTM)
Although the TTM Net Trade Deficit dollar amount is near historical highs, it can be put in perspective by comparing the value to US GDP. As the chart below shows, the current records are still below the 2006 highs before the Great Financial Crisis.
The value currently sits at 3.75% which is the lowest level since Feb 2022.
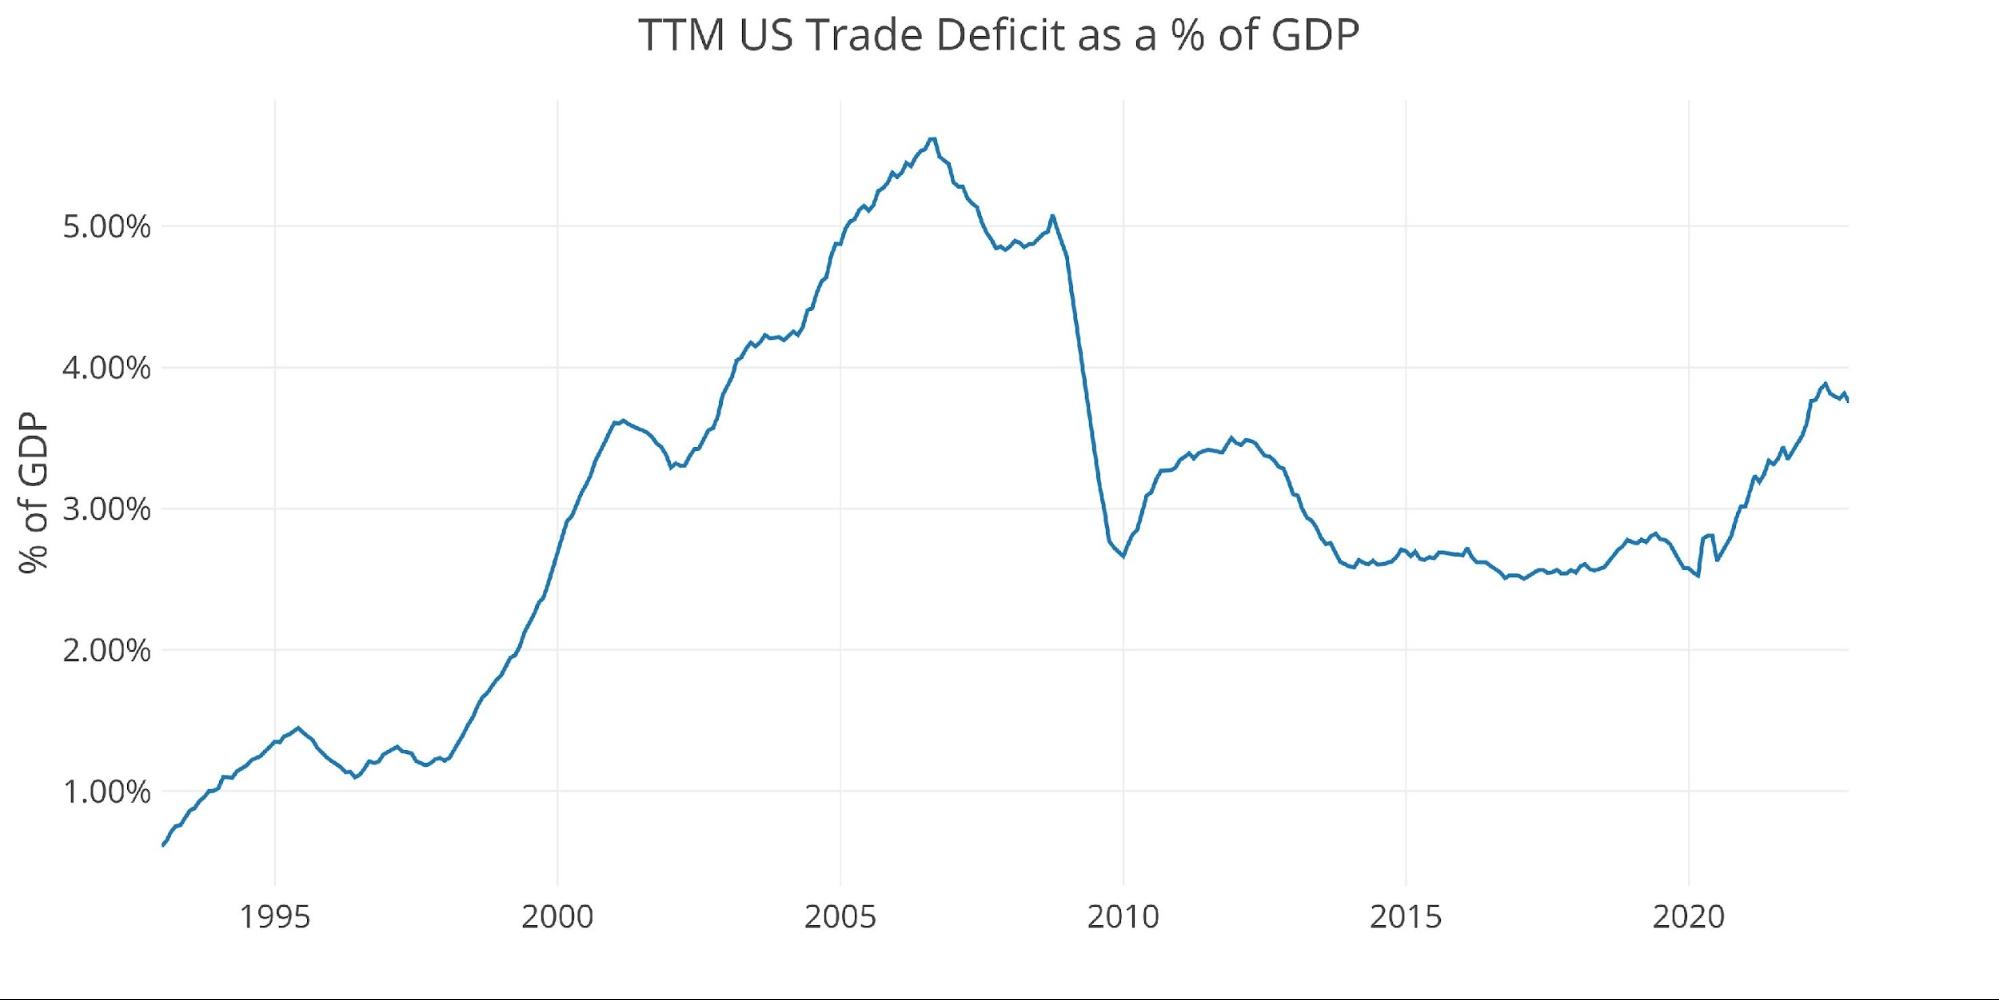
Figure: 6 TTM vs GDP
The chart below shows the YTD values. 2022 is still well above prior years by a significant margin. Even with the recent drop in November, the YTD deficit is still at all-time highs.

Figure: 7 Year to Date
Wrapping up
The Trade Deficit can be interpreted in many ways. On one side, a larger trade deficit is a sign of a weak economy that consumes more than it produces. A trade surplus or shrinking trade deficit can be a sign of a strengthening economy.
Unfortunately, that does not appear to be the case here. The falling trade deficit is a result of falling imports not a surge in exports. This is a further sign of a weak consumer that is seeing inflation eat away at purchasing power. The current recessionary environment is also not helping.
Tomorrow, the BLS will release the employment picture. The SchiffGold analysis tomorrow will show multiple data points that suggest the employment picture is much weaker than the headline number suggests.
In the meantime, the trade data is one other data point that is showing a weak economy, prompting a Fed pivot sooner than most expect.
Data Source: https://fred.stlouisfed.org/series/BOPGSTB
Data Updated: Monthly on one month lag
Last Updated: Jan 05, 2023, for Nov 2022
US Debt interactive charts and graphs can always be found on the Exploring Finance dashboard: https://exploringfinance.shinyapps.io/USDebt/
More By This Author:
A Bet On Bitcoin Is Gambling On The WhalesManaged Money Ends 2023 On Bullish Note
Slow Pace Of Balance Sheet Reduction Calls Into Question Fed’s Commitment To Inflation Fight


