
Trade Data: China Grows And U.S. Shrinks
According to international trade data reported by the U.S. Census Bureau, the U.S. economy appears to have unexpectedly slowed after having shown signs of slow but steady improvement in recent months.
That reversal can be seen in the following chart, in which we've tracked the year over year growth rate of the exchange rate adjusted value of goods and services between the U.S. and China from January 1986 through September 2016, the most recent month for which data is available at this writing.
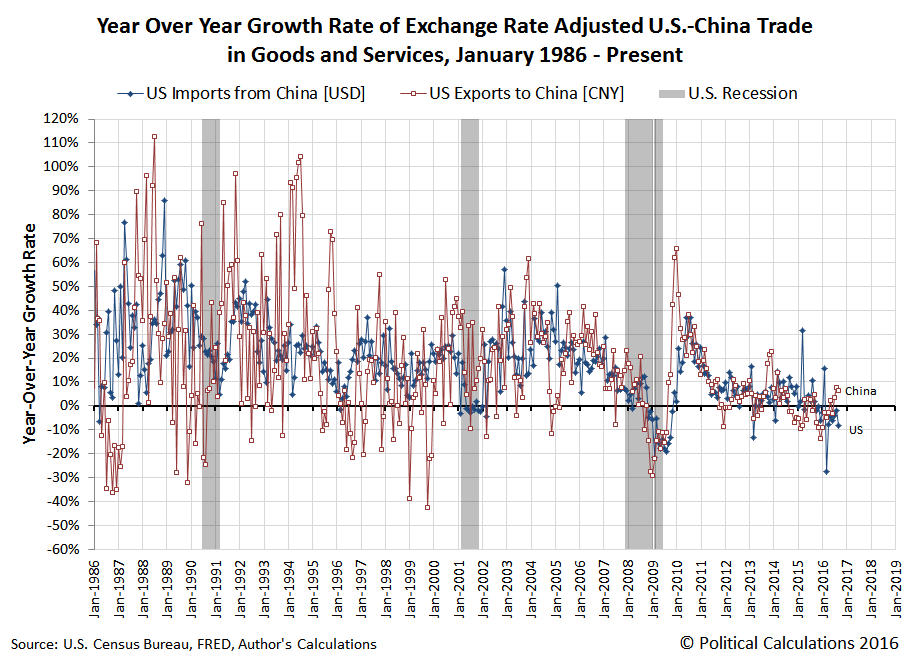
The growth rate gives us an indication of the relative health of each nation's economy. A simple reading of whether the growth rate is positive or negative tells us if the value of goods and services imported by the world's largest trading partners can tell us whether the receiving nation's economy is growing or if it is experiencing recessionary conditions. Meanwhile, the trends in the growth rate over time can tell us whether the importing nation's economy is strengthening (rising trend) or weakening (falling trend).
In the chart above, we can see that China's economy is experiencing both positive economic growth and is benefitting from a rising trend, which has largely been in place since December 2015.
Chinese imports to the U.S. economy is telling a different story. After having fallen during much of 2015, the year over year growth rate of China's exports to the U.S. bottomed in negative territory in early 2016 before beginning a slow trend of improvement, which lasted through August 2016.
And then, in September 2016, that appears to have suddenly reversed.
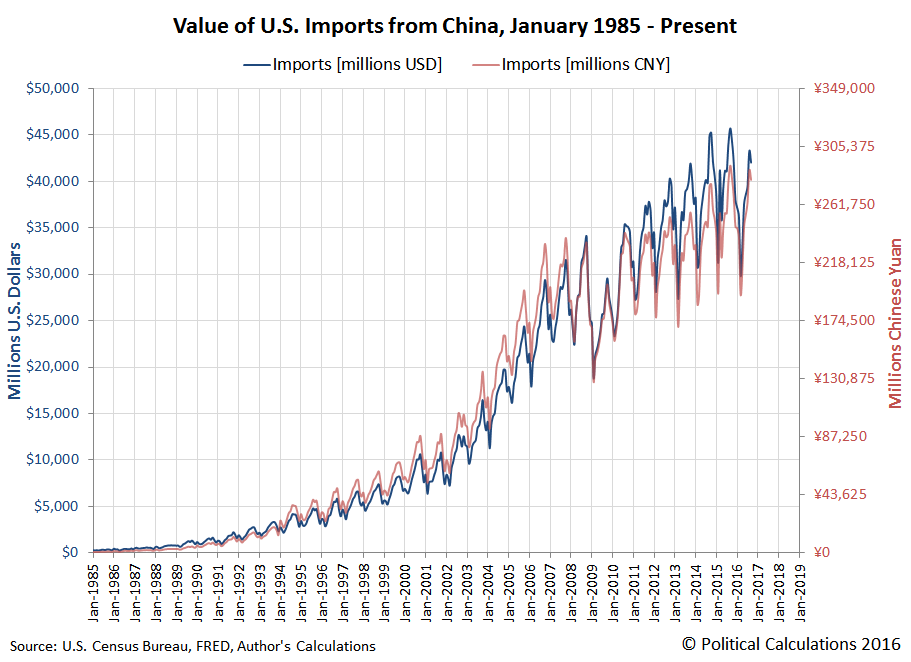
Although just one data point, what makes that single observation such a concern is that the value of goods and services that the United States imports from China follows an annual cycle, which typically peaks in either September or October of each year, which corresponds to the shipment of goods that will support the annual Christmas holiday shopping season. The following chart shows just the value of U.S. imports from China from January 1985 through September 2016.
For the U.S. economy, the key thing to recognize is that this recessionary indication developed in 2015 and despite showing some signs of recovery in 2016, it worsened in the months immediately preceding the U.S. election. If that development continued in October 2016, which we'll find out when that data is released next month, it is possible that the apparent sudden slowing U.S. economy in the months before the election could have tipped the election scales in Donald Trump's favor, as Hillary Clinton failed to either recognize or address the nation's developing economic issues during the campaign's final months.
Data Sources
Board of Governors of the Federal Reserve System. China / U.S. Foreign Exchange Rate. G.5 Foreign Exchange Rates. Accessed 3 June 2016.
U.S. Census Bureau. Trade in Goods with China. Accessed 3 June 2016.
Disclosure: None.


Interesting to watch this going forward. Dr Edward Lambert has indicated that we are at the end of this business cycle.