
Tra-La Or Ruh-Roh? - May 9, 2016
I know it may sound unthinkable, but there are times when even market technicians can’t predict the future direction of the S&P. One of those times just so happens to be right now. There are two moving average cross-overs currently flashing conflicting messages–one bullish and one extremely bearish.
Let’s take a quick look at both.
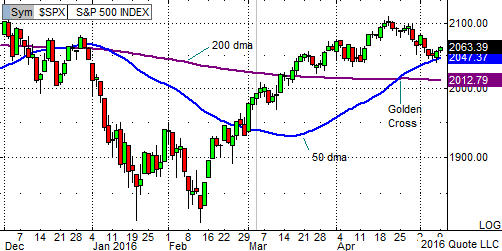
In the bullish corner we have the recent formation of a Golden Cross in the S&P’s daily chart. For those of you unfamiliar with the concept, it is when the 50 day moving average (50 dma) moves above the 200 dma on a daily chart. Historically, it has shown to be a fairly reliable indicator of a change in market direction from bearish to bullish. From the below chart we can see that a Golden Cross formed around April 26.
In the bearish corner, we have what I’m going to term a Correction Cross because no one else has yet named it. This is when the 50 dma moves below the 100 dma on a weekly chart, not a daily one. A Correction Cross has formed only twice in recent history. The first was at the end of beginning of April, 2001 which heralded the tech correction. The second time was in late June, 2008 at the beginning stages of the mortgage crisis. Here’s what the chart looks like today:
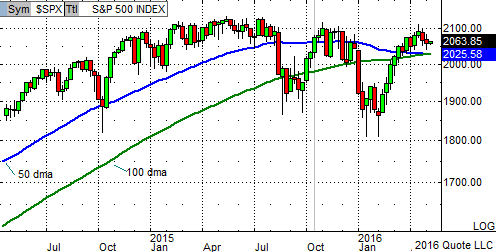
The above chart shows that it may be a bit too early to call a Correction Cross, but it’s ominously close. What does this all mean? Well, the only thing I know for sure is that right now I don’t know anything for sure. For this reason, I would recommend that sitting on the sidelines may be the most prudent place for cautious investors , at least until market direction is confirmed, one way or the other.
Disclosure: None


