
To Fear Or Fight The Fed
While Wednesday's FOMC rate cut announcement stole the spotlight from other data points and prognostications recently, there was certainly a lot going on for investors to digest or brush off. Between the Bank of America Fund Manager Survey to the Duke CEO Survey, investors and analysts alike kept their head on a swivel heading into the Fed's announced 25 bps rate cut.
The key takeaway with regards to the economy or the market has been that while both have performed rather well in 2019, they have done so under a cloak of great pessimism. A survey of 225 chief financial officers by Duke University shows pessimism on the U.S. economy has been growing steadily this year, despite record low unemployment and strong consumer spending.
The quarterly Duke University/CFO Global Business Outlook of 225 CFOs found that a majority of U.S. CFOs (53%) believe that the country will be in a recession by the end of the third quarter next year. Sixty-seven percent see a recession by the end of 2020.
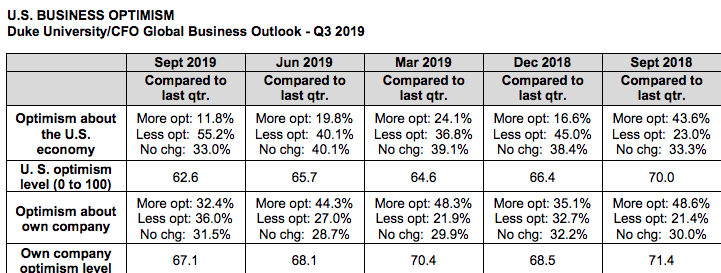
“Dr. No is back,” Duke University Finance Professor John Graham, the author of the report, said, referring to the increasing pessimism of CFOs. Those “growing more pessimistic outnumbers those growing more optimistic by a five to one margin.”
While the CFO survey indicates levels of optimism or pessimism, it doesn't tell us why? As investors and analysts who are bombarded with the daily trade headlines, however, we understand that the protracted trade feud has been the main contributor to the global growth slowdown and general pessimism.
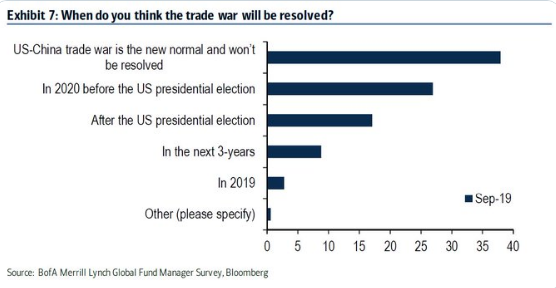
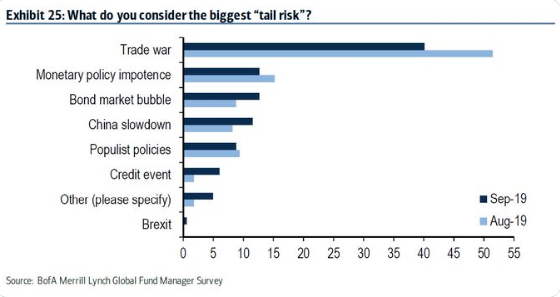
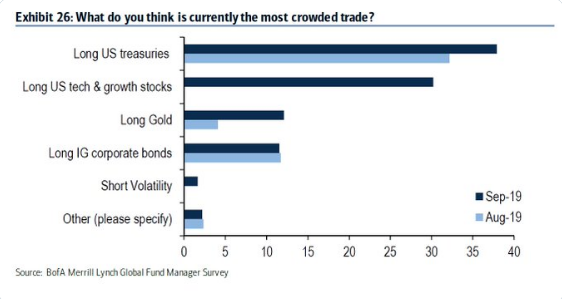
As shown in the Bank of America FMS chart above, Fund managers aren’t optimistic on trade, making the expectation of a deal the non-consensus thesis. In fact, the trade war was considered the biggest tail risk in the latest FMS, which was conducted from September 6-12. However, it fell from getting about 50% of the vote to about 40 percent. As displayed in the chart below, over 35% of managers think the U.S. China trade war is the new normal which won’t be resolved. Less than 5% see it being resolved this year. Twenty-five percent say a deal will be made before the U.S. presidential election in 2020.
Regardless of this pessimistic attitude regarding the economy, mainly attributable to the trade war, fund managers have still been chasing equities higher.
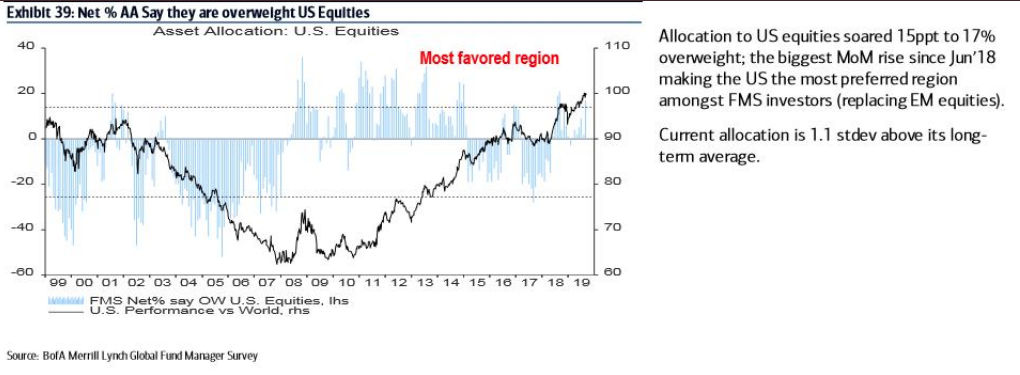
Cash levels fell from 5.7% in June to 4.7% in September as managers might be chasing equities. They are chasing U.S. stocks for the most part. As displayed in the chart above, allocation to U.S. stocks increased 15 points to a net 17% overweight, the biggest jump since June 2018.
With regards to the latest FMS, it should be recognized that fund managers generally underperform the benchmark returns for any given calendar year. As such, investors should not consider the FMS as a guide for market positioning and or portfolio modeling.
Our final investor survey came Thursday and in the form of the AAII survey of investor sentiment.
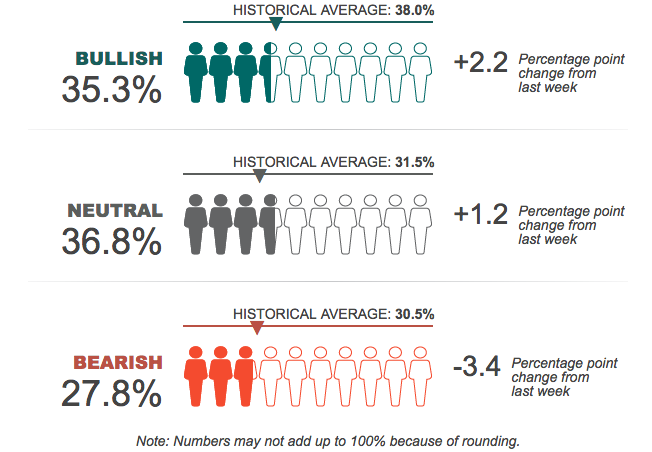
Bullish sentiment has been slowly moving higher over the last 3 weeks, but still remains below the historical average. Having said that, the bearish sentiment has finally tipped under the historical average. With the S&P 500 near record highs once again and earnings relatively flat YoY, the survey may prove a contrarian indicator or a near term top in markets is ahead.
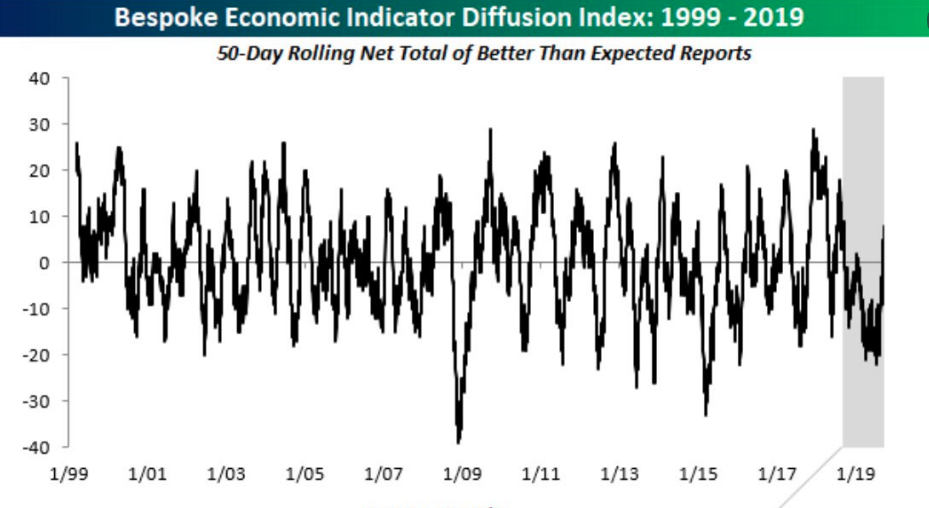
As noted previously, while investor sentiment has waned for much of 2019 and of late, the economic data has proven rather strong. The economic data has largely surprised to the upside for much of the hard data and some of the so-called soft data. We've made note of the economic data surprises to the upside as reflected by the Citi Economic Surprise Index moving into positive territory. But Bespoke Investment Group also has an Economic Surprise Index of its own that has shown a very similar result. (See Chart Below)
And speaking of stronger than expected economic data, the housing sector data released Wednesday also proved to come in ahead of economists' expectations. Total housing starts in August were above expectations, and starts for June and July were revised up combined. This was the highest level of starts in 12 years. The housing starts report showed starts were up 12.3% in August compared to July, and starts were up 6.6% year-over-year compared to August 2018.
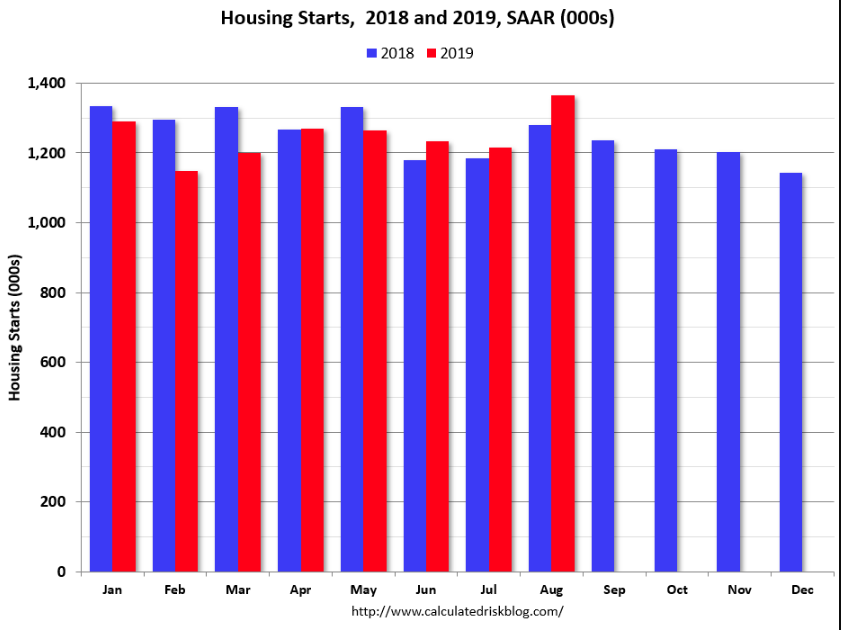
Single family starts were up 3.4% year-over-year, and multi-family starts were up 13.7% YoY. Much of the strength this month was in the volatile multi-family sector. Starts were up 6.6% in August compared to August 2018. Year-to-date, starts are down 1.8% compared to the same period in 2018.
Permits to build additional homes, meanwhile, rose 8% to a seasonally-adjusted annual pace of 1.42 million from July’s 1.32 million. For permits, economists polled by MarketWatch expected a rate of 1.30 million.
Between the strong growth in mortgage purchase applications reported on Wednesday and the solid gains in single-family home starts and building permits, it is obvious that residential investment is turning higher. Additionally and with respect to the pessimism surrounding the economy, it is unusual to see this activity if we are supposedly 12 months in front of a recession.
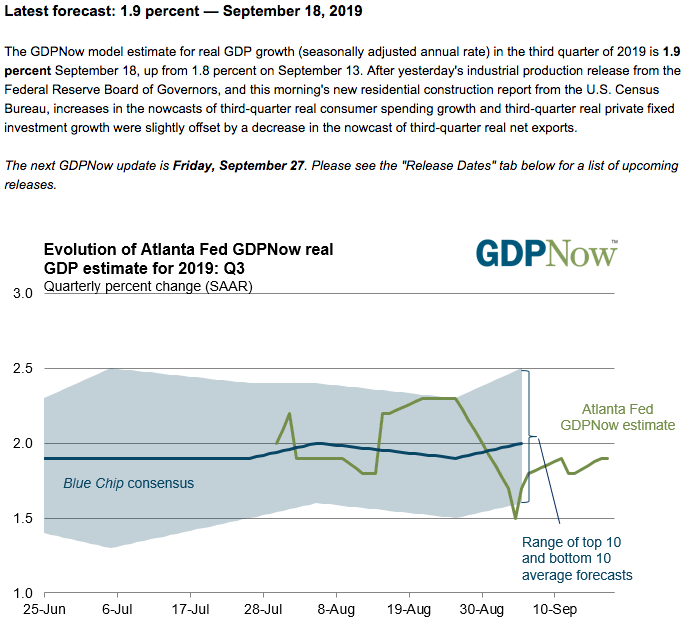
Furthermore, with residential spending moving higher alongside rising industrial production, the Atlanta Fed's latest GDPNow forecast for Q3 GDP has been revised slightly higher, to reflect the strength in the hard data. The GDPNow forecast moved up from 1.8% to 1.9% as of September 18, 2019.
And it's not as if the economic data hasn't been relatively strong through much of 2019. Investor pessimism surrounding the economy that seems unfitting has unnerved markets and found a flight to safe haven assets as the theme of markets in 2019. This produced one of the most overcrowded bond market trades in recent history, according to the aforementioned FMS survey.
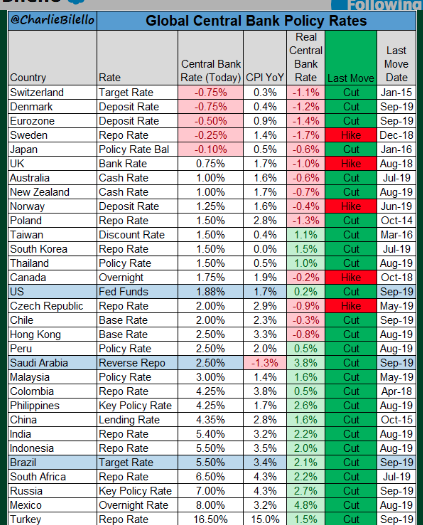
With many central banks moving to lower rates/ease, it would seem as though investors have already done much of the heavy lifting for central banks. Nonetheless, Charlie Bilello updates as to the latest and FY19 central bank activities in the following table and notes. "Global Central Bank Update... -Fed cuts rates by 25 bps to a range of 1.75%-2.00%, 2nd cut this yr. -Brazil cuts rates by 50 bps to an all-time low of 5.50%. -Saudi Arabia cuts rates by 25 bps to 2.50%."
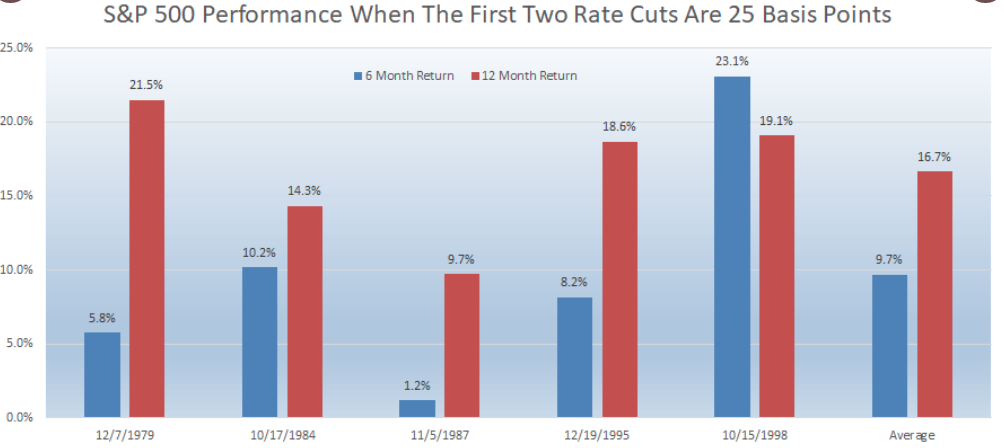
Ahead of the market's opening bell on Thursday, the rest of the world has responded to the latest FOMC, 25 bps rate cut with a favorable equity market appetite. Most global equity markets are higher on the trading session early Thursday morning. With that being said, history tells us that if the first 2 FOMC cuts in a new cycle are 25 basis points, stocks historically have done well. According to a recent study from LPL Financial, the last 5 cycles saw S&P 500 up 9.7% six months later and 16.7% a year later, when the first 2 cuts were 25 bps cuts.
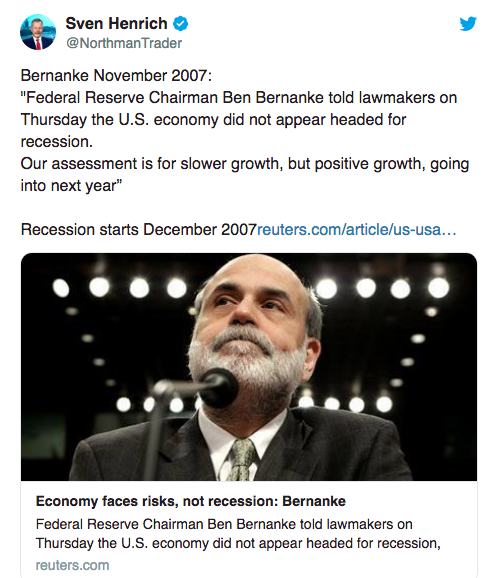
While you'll likely see other analogues that discuss market performance post rate cuts or as an easing cycle commences, it is important to focus on the details of the cut. Looking back at the previous two recessions (2001 and 2008), the Fed cut rates 50 basis points (.50%), not 25 bps, to kick off the new cycle of rate cuts. In reviewing what the Fed said at the time, and policymakers didn’t foresee a recession; the larger .50% cut might have been the Fed's way of showing how concerned they really were at the time. Maybe the Fed knew there potentially was trouble underneath the surface of the economy and markets, despite suggesting they don't foresee a recession. This idea was highlighted in a recent article by Sven Henrich, infamously known as the Northman Trader on Twitter. Sven postulates the following:
"Markets topped in October 2007 following the Fed’s September rate cut. That November, Ben Bernanke, then Fed chair, said there wouldn’t be a recession. According to a November 2007 Reuters report, Bernanke told a congressional committee: “Our assessment is for slower growth, but positive growth, going into next year.” The U.S. economy entered recession in December 2007."
Sven is doing a sound job of twisting the former Fed chairman's words, but we get the picture being painted. To reiterate our point on easing cycle comparisons, the details loom large as to what we could or should expect from the economy and market going forward. In 2007, the first cut was a deep one at 50 bps and was followed by a recession. Easing cycles from 1987, 1995 and 1998 were found with 25 bps cuts, no recession and markets moving higher both 6 and 12 months later.
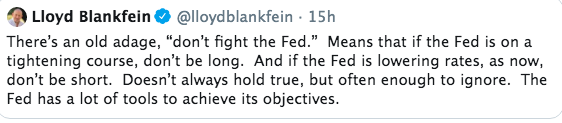
Moreover, and as you've probably heard the saying many a time before, "don't fight the Fed"! Goldman Sachs' Lloyd Blankfein reminded investors of this important market colloquialism in a tweet Wednesday.
But Charlie Bilello took a bit more of a sarcastic approach toward Blankfein's tweet and usage of the "old age" of not fighting the Fed in a tweet retort. Oh yes, folks, that's how Twitter works, it's a battle of limited information narrated for bias implementation.
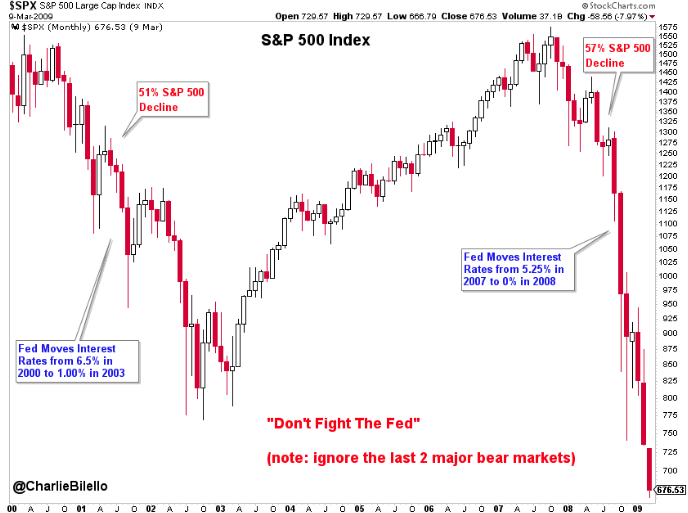
"Jan 3, 2001: Fed cut rates 50 bps & S&P closes @ 1,347. S&P declines 43% from there to its Oct 2002 low while Fed cuts the whole way down. Sep 18, 2007: Fed cut rates 50 bps & S&P closes @ 1,519. S&P declines 56% from there to its Mar 2009 low while Fed cuts the whole way down."
As we can see, Bilello forgoes past equivalent rate cutting cycles that began with 25 bps cuts in favor of focusing on that which was most recent and began with 50 bps cuts. Recency bias looms large. Nonetheless, let's take a look at exactly what changed in the Fed's statement on Wednesday and as they cut rates for the 2nd time in 2019.
Information received since the Federal Open MarketCommittee met in
JuneJuly indicates that the labor market remains strong and that economic activity has been rising at a moderate rate. Job gains have been solid, on average, in recent months, and the unemployment rate has remained low. Althoughgrowth ofhousehold spending haspicked up from earlier in the year, growth ofbeen rising at a strong pace, business fixed investmenthas been softand exports have weakened. On a 12-month basis, overall inflation and inflation for items other than food and energy are running below 2 percent. Market-based measures of inflation compensation remain low; survey-based measures of longerterm inflation expectations are little changed. Consistent with its statutory mandate, the Committee seeks to foster maximum employment and price stability. In light of the implications of global developments for the economic outlook as well as muted inflation pressures, the Committee decided to lower the target range for the federal funds rate to21-3/4 to 2-1/4percent. This action supports the Committee's view that sustained expansion of economic activity, strong labor market conditions, and inflation near the Committee's symmetric 2 percent objective are the most likely outcomes, but uncertainties about this outlook remain. As the Committee contemplates the future path of the target range for the federal funds rate, it will continue to monitor the implications of incoming information for the economic outlook and will act as appropriate to sustain the expansion, with a strong labor market and inflation near its symmetric 2 percent objective. In determining the timing and size of future adjustments to the target range for the federal funds rate, the Committee will assess realized and expected economic conditions relative to its maximum employment objective and its symmetric 2 percent inflation objective. This assessment will take into account a wide range of information, including measures of labor market conditions, indicators of inflation pressures and inflation expectations, and readings on financial and international developments.The Committee will conclude the reduction of its aggregate securities holdings in the System Open Market Account in August, two months earlier than previously indicated.Voting for the monetary policy action were Jerome H. Powell, Chair;, John C. Williams, Vice Chair; Michelle W. Bowman; Lael Brainard;James Bullard; Richard H. Clarida; Charles L. Evans; and Randal K. Quarles. Voting against the action were James Bullard, who preferred at this meeting to lower the target rangefor thefederal funds rate to 1-1/2 to 1-3/4 percent; and Esther L. George and Eric S. Rosengren, who preferredat this meetingto maintain the target range for the federal funds rate at 2-1/4percent to 2-1/24percent.
FOMC voting members actually raised their expectations for growth since the last summary of economic projections in June. The committee now sees GDP rising at a 2.2% pace this year, compared with 2.1% in June, though the longer-run expectations remain at 1.9 percent. Inflation projections were unchanged at 1.8% for 2019 and 2.5% over the longer run.
According to Goldman Sachs, the biggest surprise of the meeting was the forceful pushback to today’s cut, with five participants submitting end-2019 dots of 2-2.25 percent. According to the Fed’s “dot plot” of individual expectations, five members thought the FOMC should have held its previous range of 2% to 2.25%, five approved of the 25 basis point cut but keeping rates there through the rest of the year, and seven favored at least one more cut this year.
Goldman Sachs has updated there forecasts, reducing odds of an October cut to a 65% chance of a 25 bps cut, a 5% chance of a 50 bps cut, and a 30% chance of no change (vs. 70%/10%/20% previously). The firm sees an 85% chance of at least one cut by year-end.
Despite the 25 bps cut issued on Wednesday by the FOMC, rates have moved slightly higher, but more importantly, the yield curve has flattened further. The spread between the 2/10s Treasurys was as wide as 11 bps to start the week, but flattened to just 3 bps through Thursday's trading session.
(Click on image to enlarge)
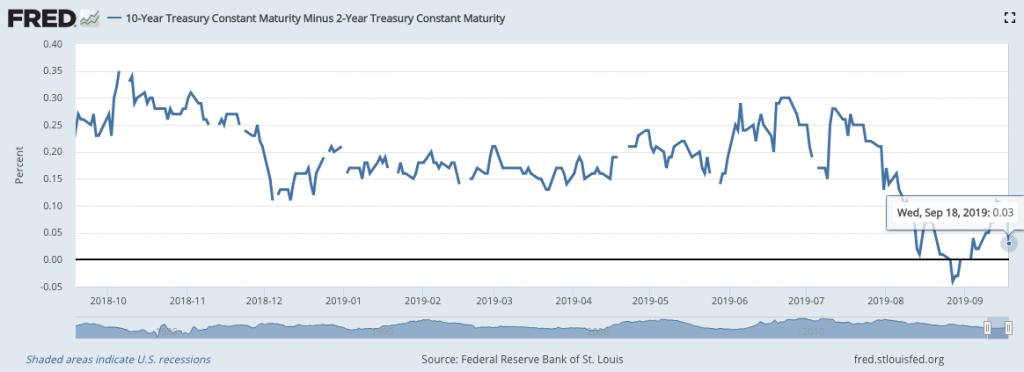
The proof is in the pudding folks. Despite the Fed's easing, the yield curve continues to remain flat and inverted along certain parts of the yield curve, highlighting that the bond market may not be responding to that which it formerly responded. The U.S. bond market remains the high yield market of the world in a world where the search for yield remains front of mind with investors.
The only thing left for investors and analysts to consider going forward, is whether this would prove the last rate cut of the calendar year. Everyone has an opinion, but the Fed has maintained its data dependency with regards to future cuts. What's most important is the message, and Jerome Powell sent a clear message to the market, for a change, that as the data goes the Fed is likely to follow. Inflation has ticked up a bit of late and the economic data has steadily outperformed, but the trade war looms large. On that front, an October meeting between China and the U.S. could tilt the scales as to whether or not the Fed is done for 2019.
Regardless of what the market headlines bear out on any given day, Finom Group (for who I am employed) is trading what the market delivers and with the FOMC rate announcement came wild swings and bouts of volatility. Within the Finom Group Trading Room (for Premium Members), we outlined to our members ahead of the FOMC announcement that the first market directional move is usually the "head fake", and not to react to that move in kind. If the market were to go lower, don't be a seller. If the market were to go higher, don't be a buyer.
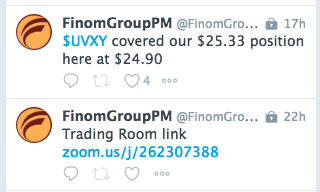
Market volatility was rather robust post the FOMC rate announcement, but VIX-ETPs like UVXY and/or TVIX didn't seem to respond as much as many might have expected. This was largely due to the heavy roll yield (started cycle over 2 points) in VIX futures that just commenced a new futures cycle (M1/October). The October VIX Futures contract also came into the cycle with roughly 5% contango, that grew by the end of the trading day.
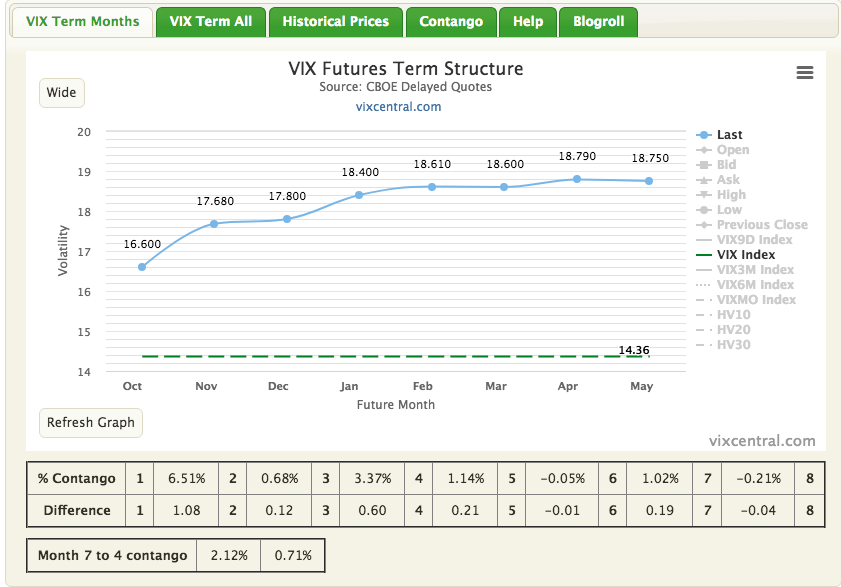
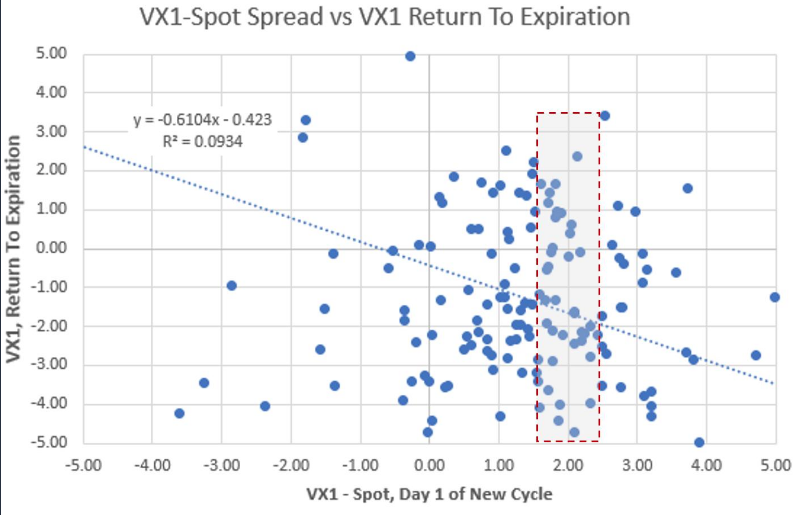
As shown in the chart above from vixcentral.com , roll yield remains solid/heavy at nearly 2.30 points. History suggests this roll yield proves favorable for short-VOL traders. That can change with a tweet and shouldn't be used as a solitary indicator of things to come, but still, let's look at recent study from Matt Thompson of Thompson Capital Management that serves to validate the main point.
"When starting as front month with a spread over spot between +1.75 and +2.25 points, VX1 has fallen 63% of the time into expiration, average -2.42 points. The average rise in the other 37% is +1.87 points."
Entering the final trading day of the week, the S&P 500 has quite literally gone nowhere. The weekly expected move is $40/points for the week and with a quad-witching Friday looming, the S&P 500 has only moved about a $1/point on the week. Heading into the weekend, I invite my TalkMarket readers to view the Finom Group weekly State of the Markets video with this link. Our emphasis in this week’s SOTM video concerns the latest FOMC rate cut announcement and what we might expect from the economy and market going forward. We look at certain analogues and past examples of rate easing cycles. Additionally, we discuss some of the more recent economic data surrounding the housing sector, which has proven to surpass economists’ expectations. Lastly, we wrap things up with a discussion on the VIX and volatility.


Recency bias looms large -- ain't that the truth!
:-)