
Three Favorite Indicators To Look At When Catching The Next S&P 500 Rally
It’s still early days in 2023, but the S&P 500 is already giving signs that this year might be a wild one. If you’re a chart enthusiast (like us!), you might have already noticed. So, allow us to highlight three significant technical indicators that could possibly point to a stock market rally…

1. Trend Lines
Trend lines, one of the most important technical indicators, are exhibiting a critical level on the S&P 500 – that recent surge of demand has propelled prices to a point of resistance, whereby a notable push to sell is indicated. How the S&P 500 will fare over the next week will be a crucial determinant of its next major move.
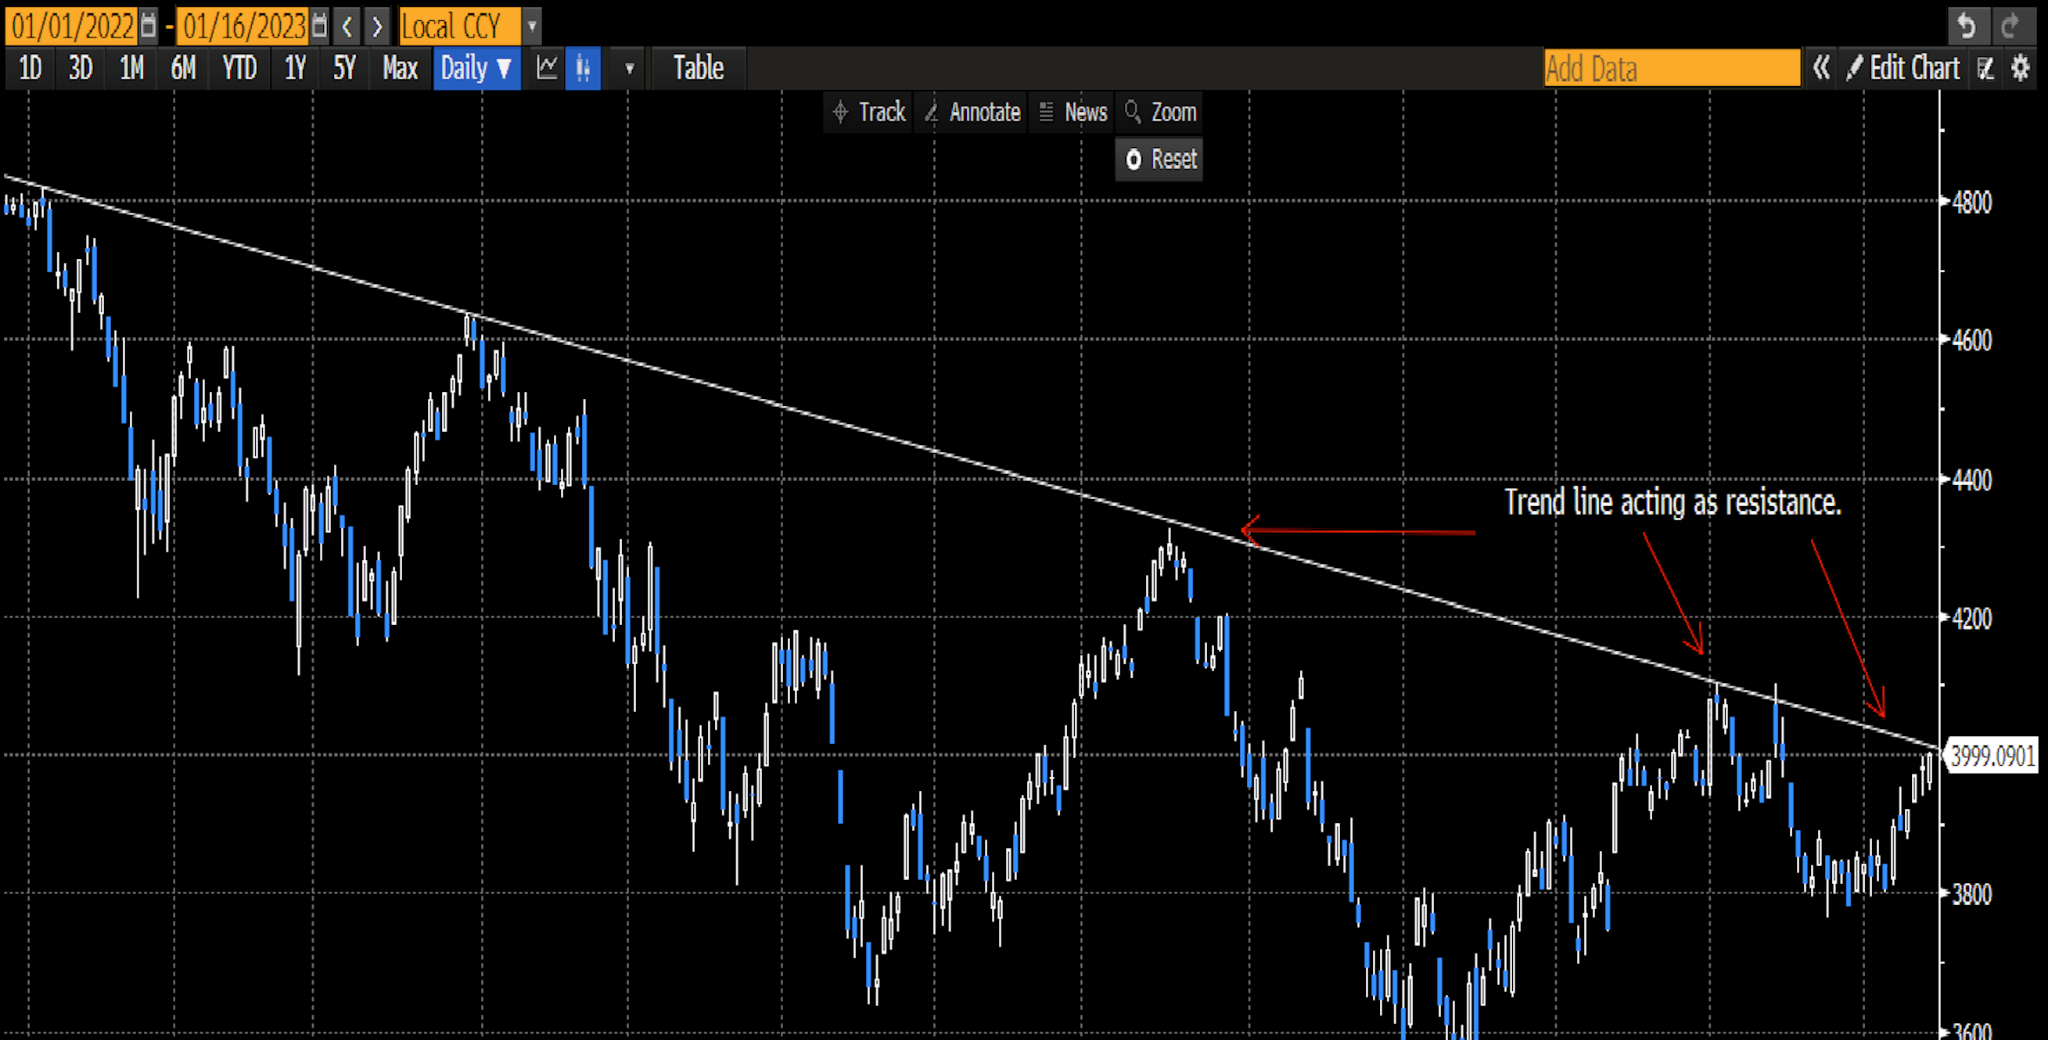
By plotting trend lines on a chart, we can track the ups and downs of pricing over both short and long time periods. This white line on the graph, beginning at the January 2022 high, spans across the lower highs of March and December, culminating in a projection just above the recent closing of 3,999 – approximating 4,020. With these points connected, we can form an idea of how prices may behave in the future, encountering potential resistance levels and support floors.
If the S&P 500 rises and breaks through the trend line resistance, this could be the catalyst for even more notable growth. Quantitative hedge funds would view such a break as a prominent indication to buy. This is something significant to be aware of!
2. Moving Averages
Don’t let yourself miss out on the usefulness of moving averages when analyzing technical indicators!
Not only can they serve as important ‘floors’ and ‘ceilings’ for an asset, since many investors rely on them to decide when to buy and when to sell, but this technical indicator also uses the closing prices from the last few days – like 50 or 200 – and gives an ever-changing average.
Observing the S&P 500 (blue line) at the moment, you’ll notice that it’s currently trading just above its 200-day moving average (red line) of 3,958, currently at 3,999.
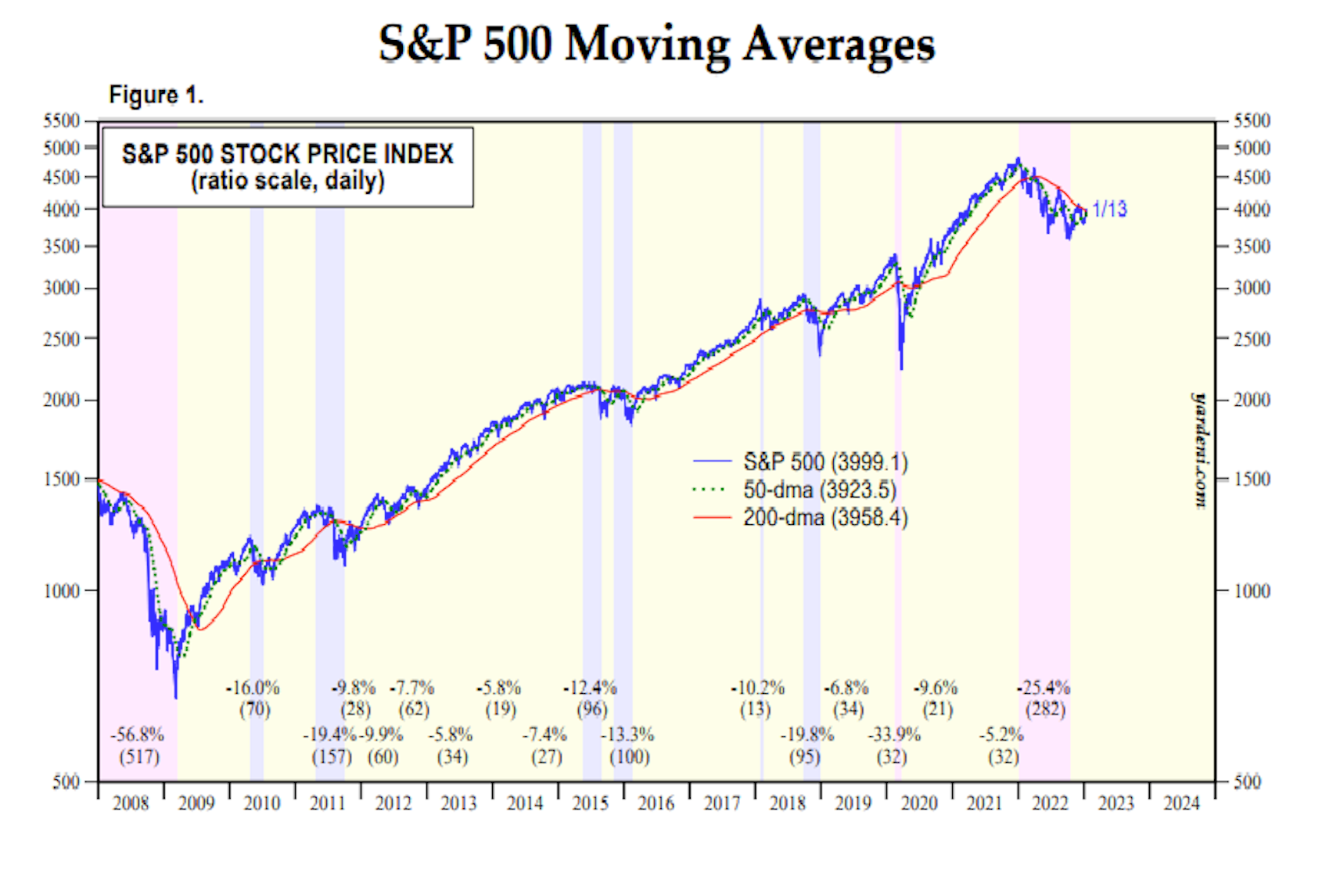
It’s too early to jump to conclusions, but the S&P 500’s recent climb above its 200-day moving average could be a hopeful sign. History tells us that in December, the index was unable to break above the trend line resistance.
Experienced chartists understand that a single moving average isn’t particularly telling, but when two averages (a faster one and a slower one) ‘cross-over’, it could indicate a shift in momentum.
Looking at the chart, the 50-day moving average of the index is at a low point of 3,923, which is below the 200-day moving average. If you want to buy, you’ll need to wait for the 50-day moving average to break above the 200-day moving average, forming a “buy signal”.
3. Market Sentiment
Not long ago, we looked at the Bank of America Global Fund Manager Survey and noticed that cash assets constituted 5.9% of the total assets, indicating a brighter outlook. When the cash levels exceed 5%, it can be a good moment to purchase, and when they dip beneath 4%, it may be the ideal time to sell.
Every month, the Bank of America survey provides insight, and the American Association of Individual Investors (AAII survey) goes even further, publishing weekly – making it a valuable contrarian indicator. Studies have shown that if the optimism levels are unusually low, there tend to be above-average market returns, and vice-versa for when optimism levels are unusually high.
Our survey reveals sentiment has shifted to neutral grounds – let’s take a deeper look into how AAII respondents have been feeling.
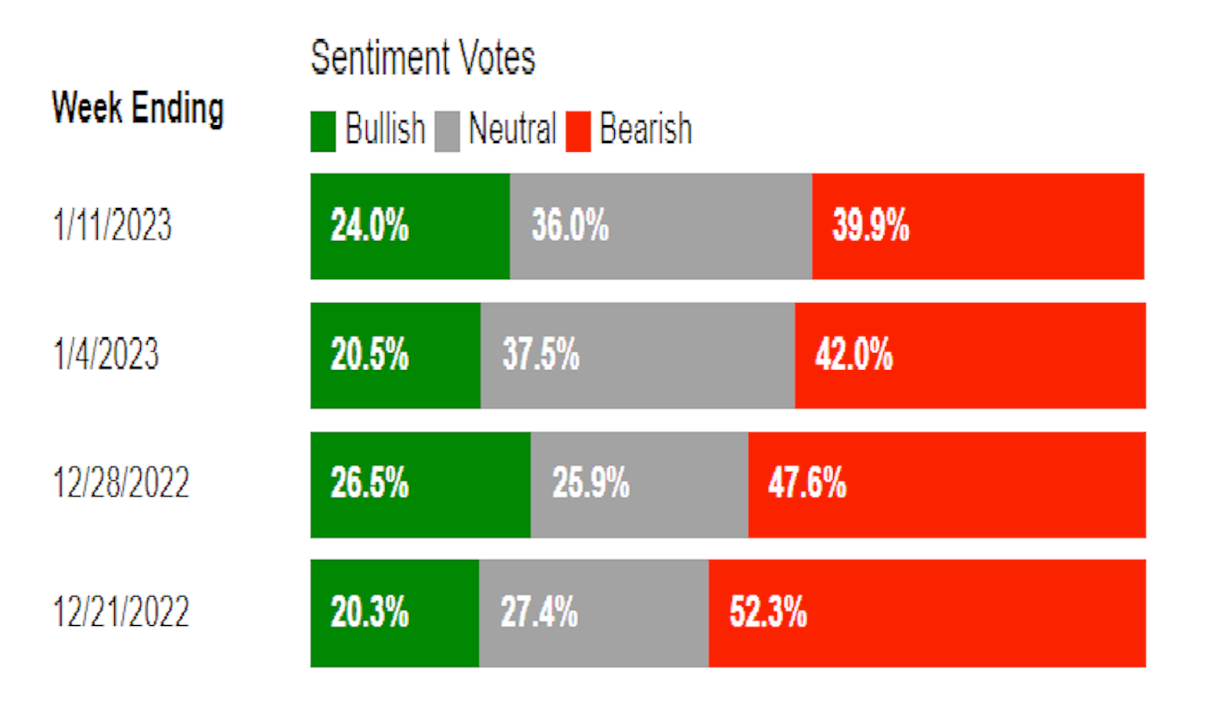
Individual investors’ pessimism about the short-term stock market direction dropped to its lowest point in ten weeks last week. Neutral sentiment also took a dip, but optimism is on the rise. Hopes for a rise in stock prices in the next six months surged to 24%, up from 20.5% the week before.
Although sentiment has improved, individual and professional investors alike are keeping their optimism subdued, given that the level of optimism has been below its historical average of 37.5% for 54 consecutive weeks and has been unusually low for seven weeks. That said, there is still room for a sentiment to strengthen and give this rally more steam. Don’t get too carried away, though!
How to Trade These Opportunities?
Trading is an intricate mix of art and science, but employing a disciplined, rules-based approach can help you limit your losses and maximize returns. If the index has breached a trend line and you’re feeling confident, you might consider buying into SP500.
If a bullish moving average crossover (between the 50-day and 200-day) follows, you could add to your position. But if the index dips below the trend line, then it would be wise to close out any long positions to avoid taking any losses.
If you’re feeling down on the stock market and think the S&P 500 could drop, why not invest in Short S&P500 (SH; 0.89%)?
Further sell the ETF when the index breaks out of its current trend line, and remember to keep your losses small so you have another chance to make a move later.
More By This Author:
Weekly Waves: EUR/USD, GBP/USD And Gas - Monday, Jan. 9How To Bet On A Chinese Recovery In 2023
Weekly Waves: EUR/USD, US30 And Bitcoin - Mon., Dec. 19
Disclaimer: CFDs are complex instruments and come with a high risk of losing money rapidly due to leverage. On average around 80% of retail investor accounts loose money when trading with high ...
more

