
Three Charts Every Strategic Investor Needs To See Today
The manipulations in the stock market are getting ridiculous.
“Someone” forced stocks higher on Friday. The S&P 500 rose 55 points in just 24 minutes started at 3:10PM. And when that didn’t do the job and sellers returned, the market was then forced 29 points higher in just three minutes!
So all in all, the S&P 500, one of the largest stocks markets in the world, was ramped roughly 2% higher via two interventions in the span of just 28 minutes.
Again, this is ridiculous.
(Click on image to enlarge)
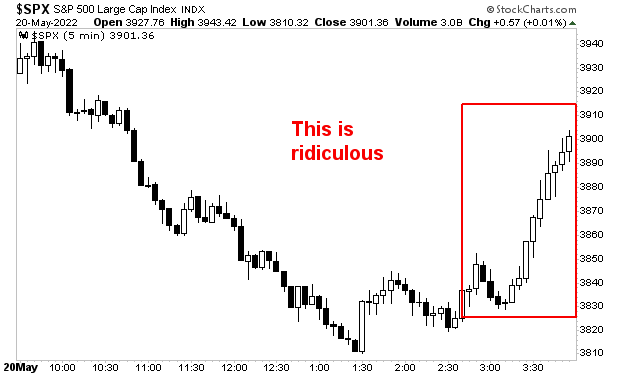
Was it the Fed? A large hedge fund? Several institutions? Who knows. The only thing we do know is that it wasn’t real buyers looking to invest at those prices… this was abject manipulation.
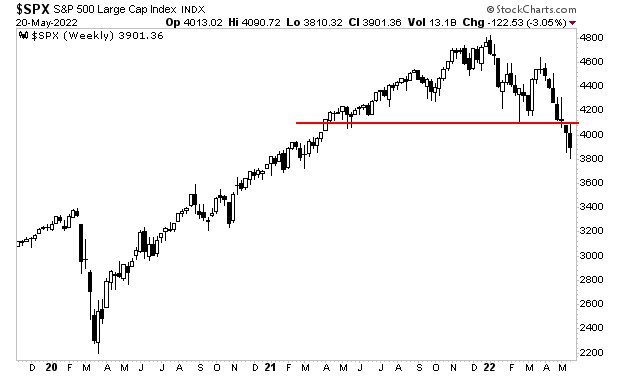
The problem with this is that it doesn’t work… stocks have broken critical support (red line in the chart below) based on the Fed ending its money printing and raising rates to 1%.
Put another way, the Fed hasn’t even begun shrinking its balance sheet and already the S&P 500 is in a bear market.
(Click on image to enlarge)
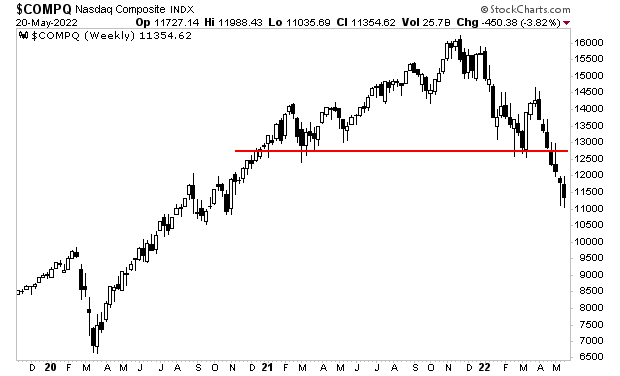
The NASDAQ is even worse. It’s unwound more HALF of the entire move from the March 2020 bottom. And again, the Fed has barely begun to tighten monetary policy.
(Click on image to enlarge)
What happens when the Fed is forced to raise rates to FIVE percent (they’re 1% now)? What happens when it tries to shrink its nine TRILLION dollar balance sheet by $1+ trillion.
You get the idea.


The exact same move to the downside during the same day isn't ridiculous but the bounce off the bottom of the channel is ridiculous? 🤣