Those Who Overlook History
Like today, soft-landing hopes were all the rage in the summer of 2007 too.
The US Fed tightened its overnight rate from 1% in May 2004 to 5.25% by June 2006 and then paused there for 15 months. As the economy slowed and credit stress mounted, the Fed administered a first cut (50bps) in September 2007, and the stock market leapt. On October 7, 2007, the Wall Street Journal (Hat-tip Michael Kantro) bubbled with optimism:
“…worries seem to be taking a back seat to renewed enthusiasm about the health of the economy and the credit markets. The market is relatively happy that the economy continues to grow, and there are a lot of people who don’t want to be on the sidelines is the market is going to move higher. The tech sector has been surging lately, as investors see those companies as less vulnerable to credit-market problems and better able to benefit from global growth.”
As usual, bullish propaganda from financial firms dominated the media. RBC’s June 2007 steady economic outlook was typical fare:
Canada’s economy gathered steam in the first quarter with an annualized growth pace of 3.7%, supported by a strong domestic economy,” said Craig Wright, vice-president and chief economist, RBC. “While overall economic growth will remain robust, the trade sector will continue to weigh on growth as the strong Canadian dollar boosts imports and restrains exports.”
On a national level, the economy should grow by 2.6% over 2007, Wright says, with 2008 expected to turn in a rate of 2.9% growth.
In reality, the great recession officially started in December 2007, and Canada’s GDP contracted by 1.06% in 2008 and 3.94% in 2009.
Although central banks slashed benchmark rates to zero by December 2008 and pumped unprecedented liquidity (QE), financial markets tanked until March 2009.
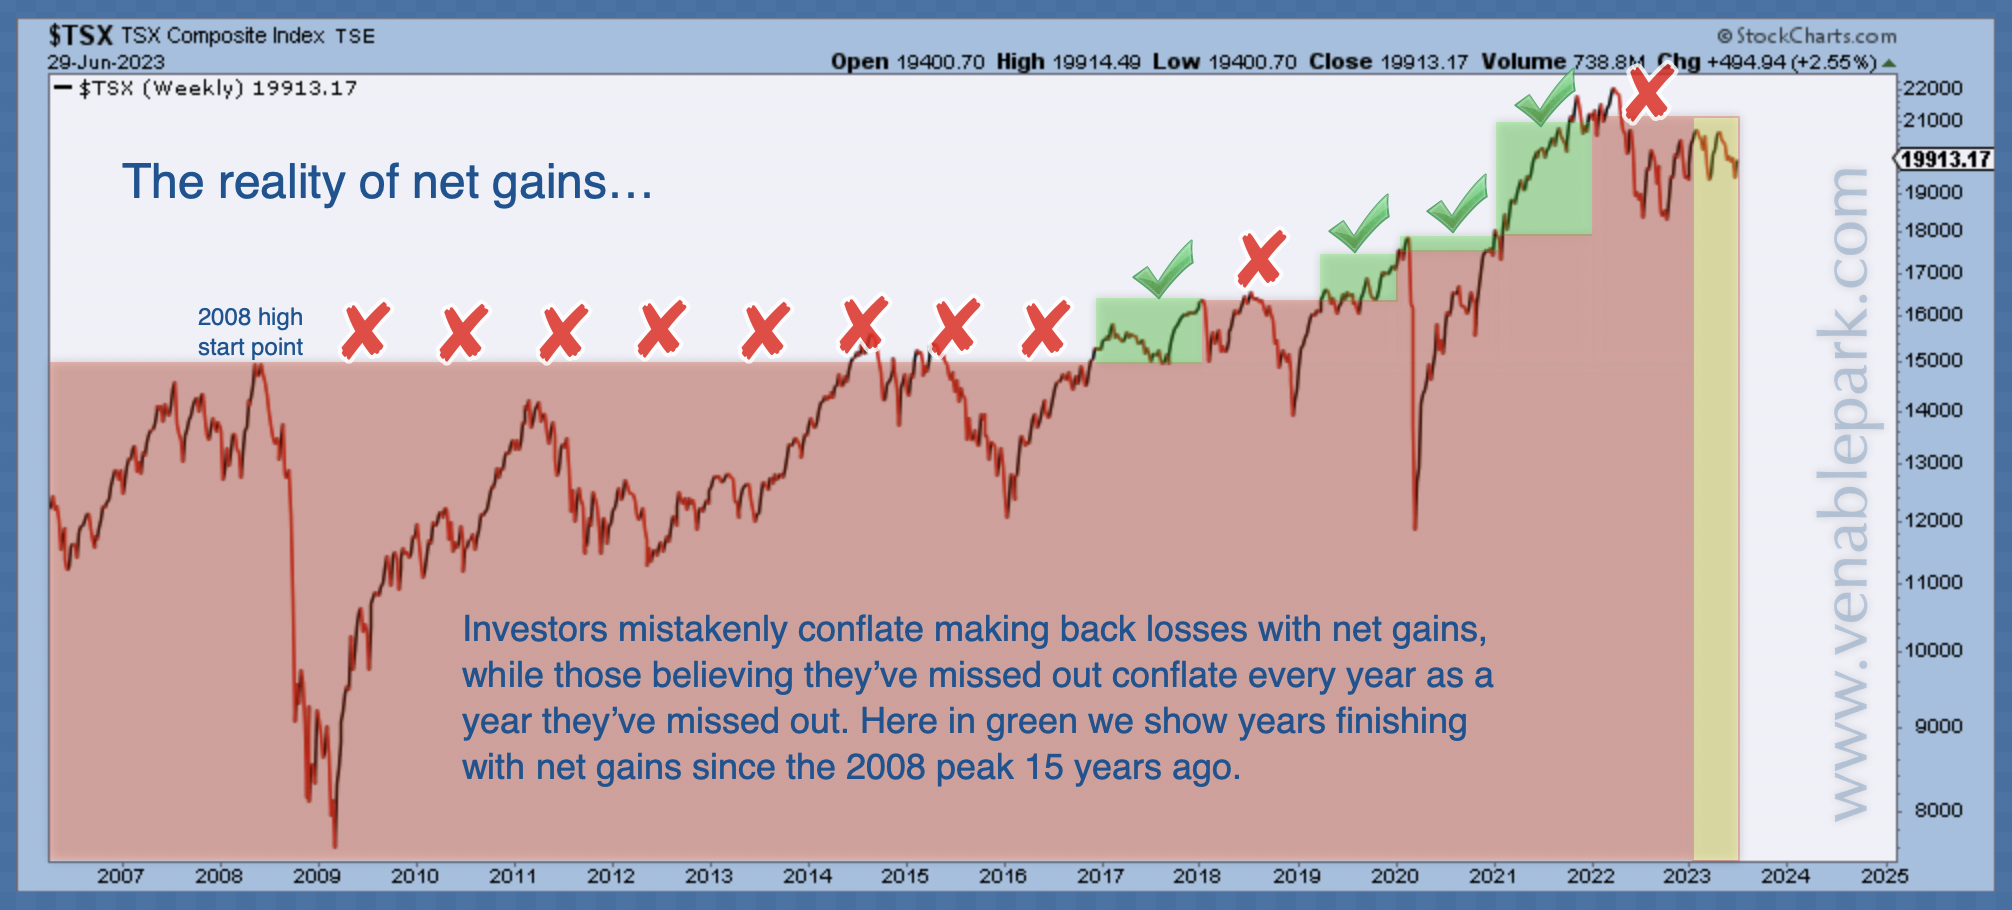
The Canadian stock market halved from its high in June 2008 (shown in my partner Cory Venable’s chart below). It could not sustain a break out above its 2008 peak until 2021’s pandemic stimuli boosted asset prices into 2022. It’s rolled over again since.
(Click on image to enlarge)
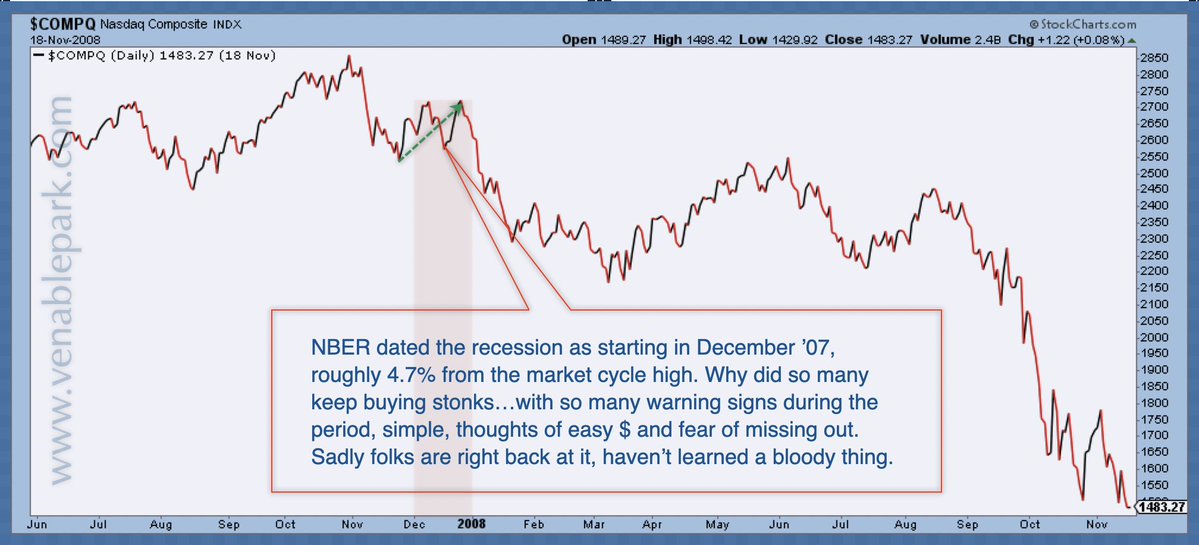
The tech-rich Nasdaq 100 index (below from June 2007 through November 2008) followed a similar pattern with a 43% decline. On the upside, the 2007-09 Nasdaq decline was mild compared with its 83% loss in the 2000-02 “correction” cycle.
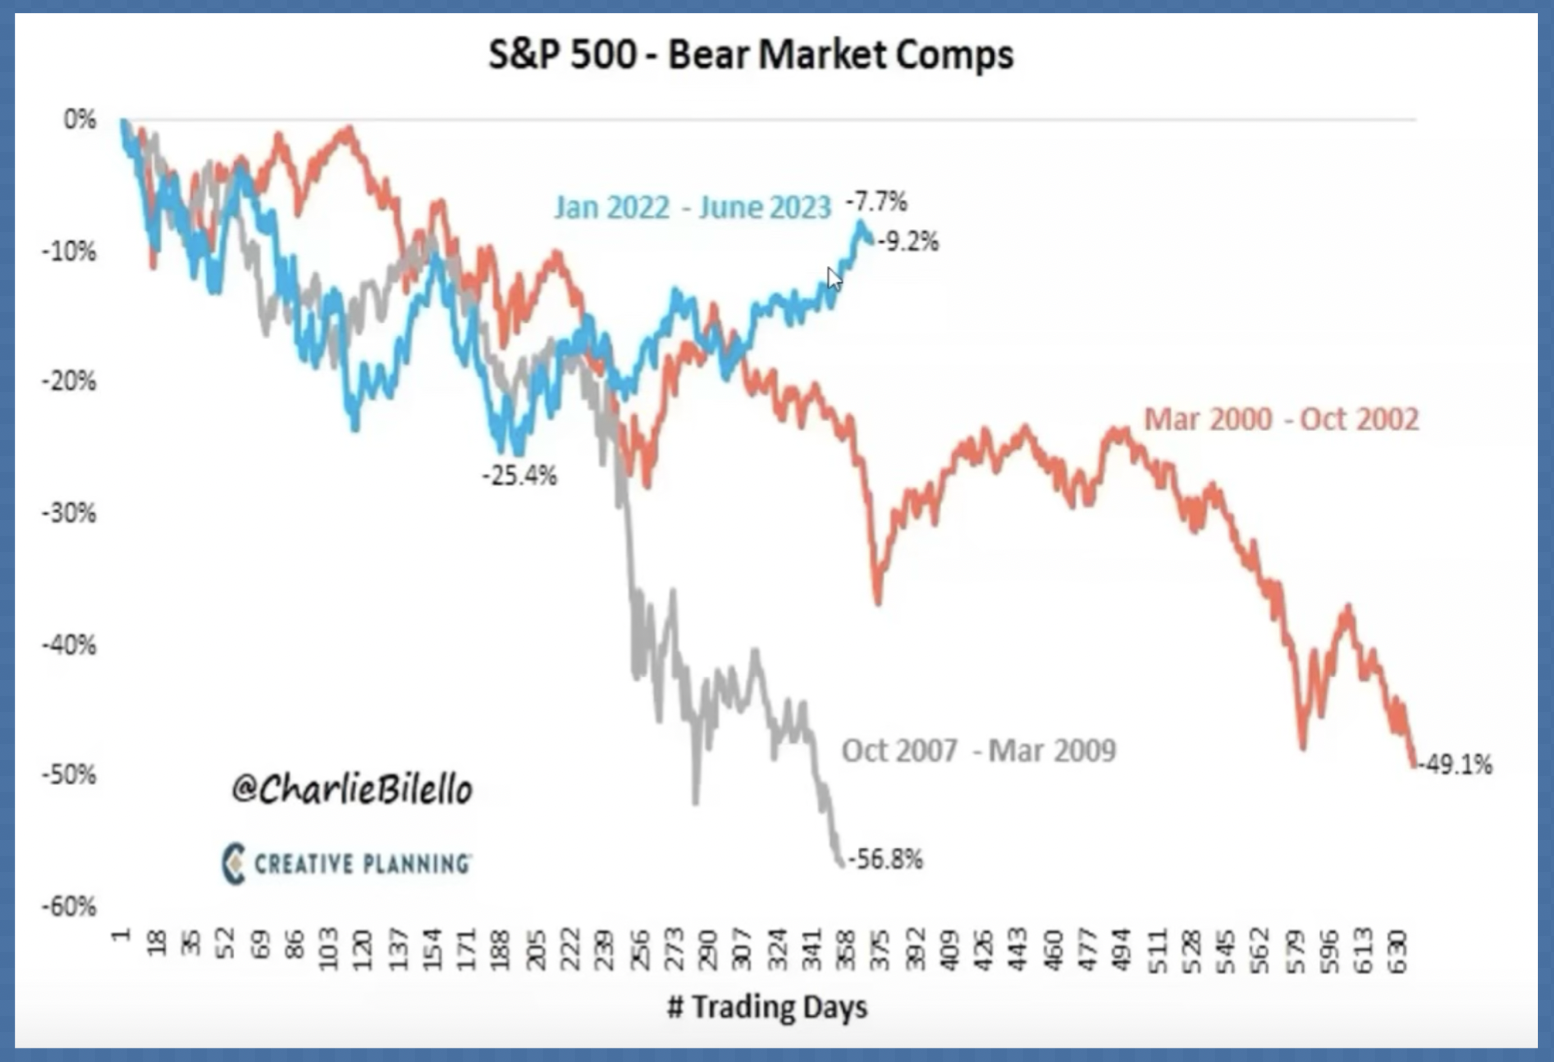
After rebounding between May and September 2007, the S&P 500 also tumbled with a peak-to-trough drop of 56% by March 2009 (shown in grey below courtesy of Charlie Bilello). A similar pattern materialized in the March 2000 to October 2002 (in orange) bear market. The blue line shows the S&P’s price action from January 2022 to June 2023 for comparison. #earlydays
(Click on image to enlarge)
The US Fed will likely pause its tightening efforts soon. But the economic cycle and stock markets have never bottomed before the pause. Bottoms come after rates have been slashed to cycle lows, unemployment is leaping, and the unprepared are liquidating in losses. Best to be aware.
More By This Author:
Central Banks Holding The Hand Brake
Corporate Bankruptcy Wave Just Started
Yields Testing Resistance (And Nerves)


