
This Hasn’t Happened In 20 Years
Something remarkable happened on Monday. It wasn’t the action of a politician, an election, or even a Fed official. Instead, this news came from the National Association of Home Builders. The NAHB released its monthly confidence index, and it rose five points in December to 76.
So why is this noteworthy? It’s important because that’s the highest reading in over 20 years. It’s even higher than the frothy days of a housing bubble. The last time the index was this high was June 1999. I should explain that any reading above 50 is considered positive. How bad was the housing crash? At its low, the homebuilder confidence index clocked in at just 8.
It’s no secret why the homebuilding industry feels better. It’s the downstream effect of the Federal Reserve cutting interest rates. This has been a great time for housing stocks. Check out some of these returns; NVR Inc. (NVR) is up 58% this year, DR Horton (DHI) is up 57%, and KB Home (KBH) is up 82%.
This is also good news for the economy. While the housing sector isn’t the largest part of the economy, it’s probably the most influential in determining the direction of the economy. This makes sense. For most Americans, buying a home is the largest purchase of their life. A few years ago, there was an important academic paper on this topic called, “Housing IS the Business Cycle.” It’s hard to disagree.
So, where will interest rates go from here? We got a hint recently at the last Fed meeting. Along with their policy statement, the Fed also released economic projections for the next few years. The projections indicate that the Fed doesn’t see itself raising interest rates next year at all.
One of My Charts of the Year
The effect on the mortgage market has been profound. The average rate on a 30-year fixed-rate mortgage in the U.S. is 3.73%. Mortgage rates are already 1% below where they were one year ago, and I think it is very likely that interest rates will stay low. That’s good for the economy and the housing sector.
This is really the culmination of a dramatic yield curve story that played out all year. Let’s take a look at one of my top candidates for Chart of the Year.
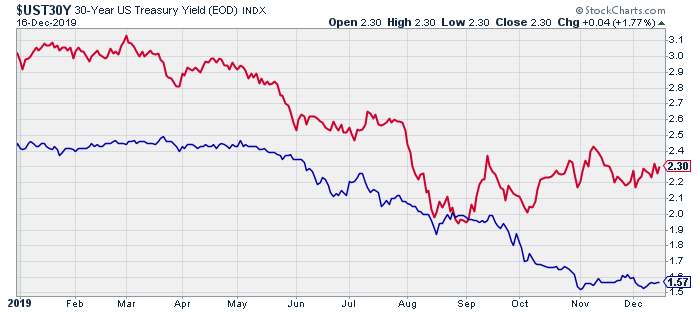
The chart above shows the yield on the three-month Treasury (in blue) along with the 30-year Treasury (in red). You can see how both were trending downward during the first half of this year. However, starting in the summer, the gap between the two narrowed dramatically. By August, the ten-year yield briefly dipped below the three-month yield. That was the dreaded inverted yield curve that made the headline for about 36 hours.
It was almost like a cry for help from the bond market. The Federal Reserve heard the pleas and moved to act. The Fed slashed rates three times in three months.
At the time, a lot of folks on Wall Street, especially the bears, thought this was the beginning of a rate-cutting cycle. The Fed said that their moves were merely mid-cycle adjustments. The Fed held firm, and it appears that the Jerome Powell and his friends on the FOMC have prevailed against the bond market.
What makes me say that? Notice how the 10-year yield (the red line) has started to stabilize in recent weeks. The yield is actually above the lows from three months ago. This probably hints at a reaccelerating economy. Also, inflation continues to remain low.
Sherwin-Williams Beat Earnings and Raised Guidance
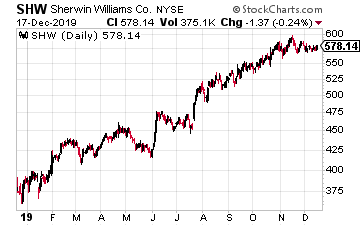
One of my favorite stocks in the housing sector is Sherwin-Williams (SHW). (Yes, I consider the paint people to be a housing stock.) Business has been going quite well. In October, Sherwin posted Q3 earnings of $6.65 per share. That was an increase of 17.1%. Wall Street had been expecting $6.48 per share.
This was a very good quarter for Sherwin. The CEO said: “Sherwin-Williams delivered strong results in the quarter as adjusted earnings per share increased 17.1% year-over-year to $6.65. Our performance in the quarter was driven by continued strength in North American architectural paint markets, which offset choppiness in some industrial end markets.
I was especially pleased to see Sherwin’s operating margin (in this case, their adjusted EBITDA margin) increased by 15 basis points to 18.9%. That tells me Sherwin is being run well.
Sherwin-Williams also increased its full-year guidance range to $20.90 to $21.30 per share. The previous range was $20.40 to $21.40 per share. Since Sherwin has already made $16.83 per share for the first nine months of this year, the new range implies Q4 earnings of $4.07 to $4.47 per share.
The Q4 report will be due out sometime in late January. I’m expecting to see more good results.
Disclosure: None.


