
This 1 Indicator Making A Strong Case For A Financial Crisis Ahead
iStock.com/jmiksjmiks
Soaring LIBOR Foretells Financial Crisis: Investors Beware
This statement may sound very bold, but it’s worth making: we could be on the cusp of another financial crisis. If this is actually the case, investors need to be extra vigilant. We could see massive declines in asset prices across the board.
Why could there be a financial crisis? As it stands, we are seeing stress build up in the banking sector.
Please look at the chart below of the London Interbank Offered Rate (LIBOR) below.
(Click on image to enlarge)
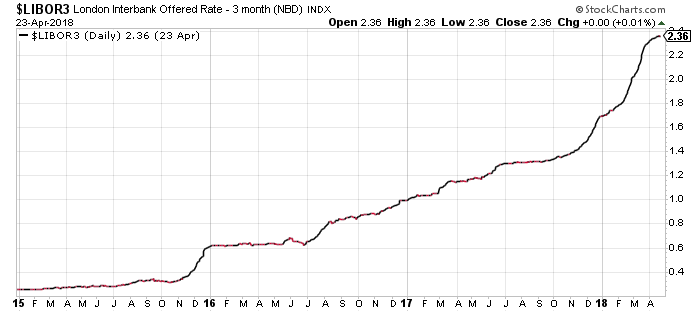
Chart courtesy of Stockcharts.com
What is LIBOR? Think of it as an interest rate for when banks borrow from each other.
As the above chart shows, in 2015, the rate stood at 0.2%. Now it’s at 2.31%. This represents an increase of over 1,000% in a matter of a few years. The chart also shows that, since the beginning of 2018, LIBOR has seen an almost vertical increase.
You see, this interest rate is also considered to be a stress indicator for the financial sector. If it soars, it tells us that stress in the financial sector could be increasing.
Did LIBOR predict the previous financial crisis? Yes.
Just prior to the 2008–2009 financial crisis, we saw LIBOR soar for a while. Between late 2004 and mid-2006, this rate went from around 2.21% to about 5.5%. This increase was in a very vertical manner as well.
What to Look Out for, Going Forward
Dear reader, I completely understand; one could easily say, “LIBOR could be increasing because the Federal Reserve is raising interest rates.”
Yes, if the most basic rates in the economy are increasing, it’s valid to think that. But the pace at which LIBOR is increasing is worth watching, and it’s worrisome too. As I said earlier, the rate has increased by more than 1,000% in the last few years, and it looks like it could soar further.
If LIBOR is correct and there’s a financial crisis brewing, it’s important that investors know the consequences.
A financial crisis usually means asset prices declining across the board and a lot of wealth destruction. In the last crisis, a massive sum of wealth was destroyed, and it could be the case in the next crisis as well.
Let me make it very clear, this is not a recommendation to sell everything whatsoever. Rather, take all of this as a warning of what could be brewing. You won’t hear about this in the mainstream media.
This Could Be the Best Insurance Policy for a Financial Crisis
With all this said, I am keeping a close eye on gold prices.
Gold is usually one of the best insurance policies for a financial crisis. The yellow precious metal provides a lot of safety and protects wealth when investors are panicking and assets are declining in value.
Want proof? Just look at what happened to gold prices between 2007 and 2011. The chart below plots gold prices (top section) and the performance of gold and stocks (bottom two sections).
(Click on image to enlarge)
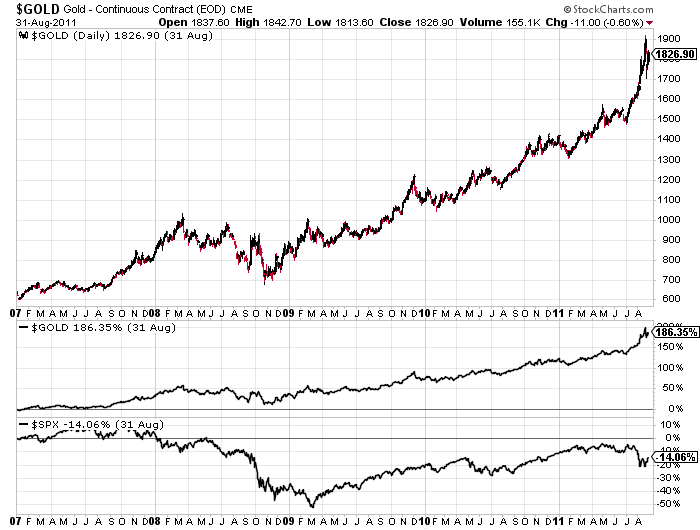
Chart courtesy of Stockcharts.com
In the same time period that gold prices soared 186%, the S&P 500 Index declined by more than 14%.
One of the best things about gold is that it has a solid track record of doing the same thing over and over again for a very long time. In the next financial crisis, gold could be the place to be.
Disclaimer: There is no magic formula to getting rich. Success in investment vehicles with the best prospects for price appreciation can only be achieved through proper and rigorous research and ...
more


Let me explain the basic principle how most Forex systems work. They are tuned up to work in a specific market condition. They often make money in a trending market, but loose money in a choppy market. It is not a problem as long as the market is trending and the system is making more money than it loses. Such a system can be profitable for several months and you would be happy with it. BUT...
PREPARE FOR THE WORST...
Market change over time. A well designed system starts with trend analysis to stay away from potentially losing trades. There are two problems of how a Forex system recognizes the trend.
PROBLEM: FALSE "STRONG TREND" INDICATION.
The system responds only to immediate price action. An explosive price movement that is usually the result of news release is tempting people to jump in and make a profit. It looks like a "strong trend", but what usually happens next is a hard fall.
To avoid falling into this trap, check for the SOLUTION to find a REAL trend:
==> http://www.forextrendy.com?nsjjd92834
SECOND PROBLEM: TREND RELIABILITY
Most systems use various indicators to determine the trend. Actually, there is nothing bad about using indicators. One Simply Moving Average can do the job. The problem comes with the question: "Is the market trending NOW?" Whether the market is trending or not trending is not like black and white. The correct question is: "How well the market is trending?"
And here we have something called TREND RELIABILITY.
Trends exist and they can be traded up and down for a profit. You have to focus only on the most reliable market trends. "Forex Trendy" is a software solution to find the BEST trending currency pairs, time frames and compute the trend reliability for each Forex chart:
==> http://www.forextrendy.com?nsjjd92834