
The "Typical" Annual Trajectory Of The S&P 500
What is the "typical" annual trajectory for the S&P 500 during a year?
We're attempting to answer that question today using some 66 years worth of historical data for the S&P 500 from 1 January 1950 through 31 December 2015, as published by Yahoo! Finance.
The way we'll do that is to calculate each trading day's closing price for the S&P 500 for each of these years as a percentage of the value at which it closed on the first trading day of each year. Then, we'll calculate both the average percentage recorded for each respective trading day of all these years and also the median percentage recorded for each respective trading day of each year. The results of these calculations should reasonably represent what might be considered to be the "typical" annual trajectory of the S&P 500.
As an added bonus, because the actual trajectory of the S&P 500 during these years can be very different from these "typical" trajectories, we'll also identify the best ever and worst ever values recorded on each trading day during this 66 year-long period, just to give a sense of how different the actual performance of the S&P 500 has been with respect to its "typical" performance. Our results are presented in the following chart, where the divisions on the horizontal axis roughly correspond to each calendar month of the year.
(Click on image to enlarge)
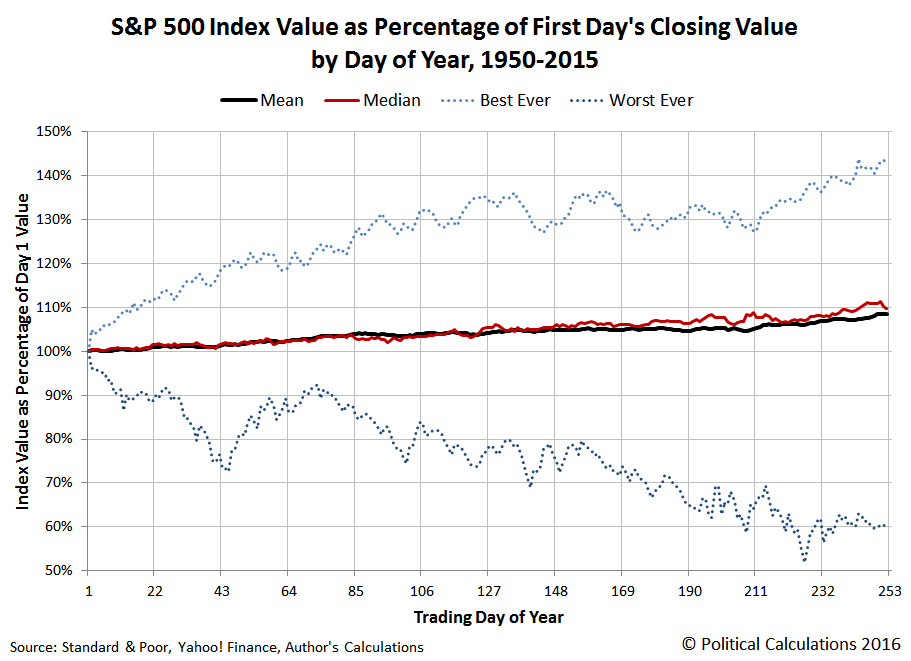
In the chart above, the mean annual trajectory of the S&P 500 would involve the S&P 500 rising to be 108.5% of the closing value recorded on the first day of the year for the index. The median annual trajectory comes out slightly higher at 109.7% of the index' first day of the year closing value.
Meanwhile, the best ever trajectory shown in the chart above, which represents the highest value recorded in any year, and not the trajectory of any specific year, shows the S&P 500 reaching as high as 144.1% of its first day of the year starting value by the end of the year. The worst ever trajectory, representing the lowest value recorded in any year for each trading day, shows the S&P 500 falling to be just 61.5% of its value at which it closed on the first day of the year.
Just for fun, lets zoom in on just the mean and median annual trajectories for the S&P 500.
(Click on image to enlarge)
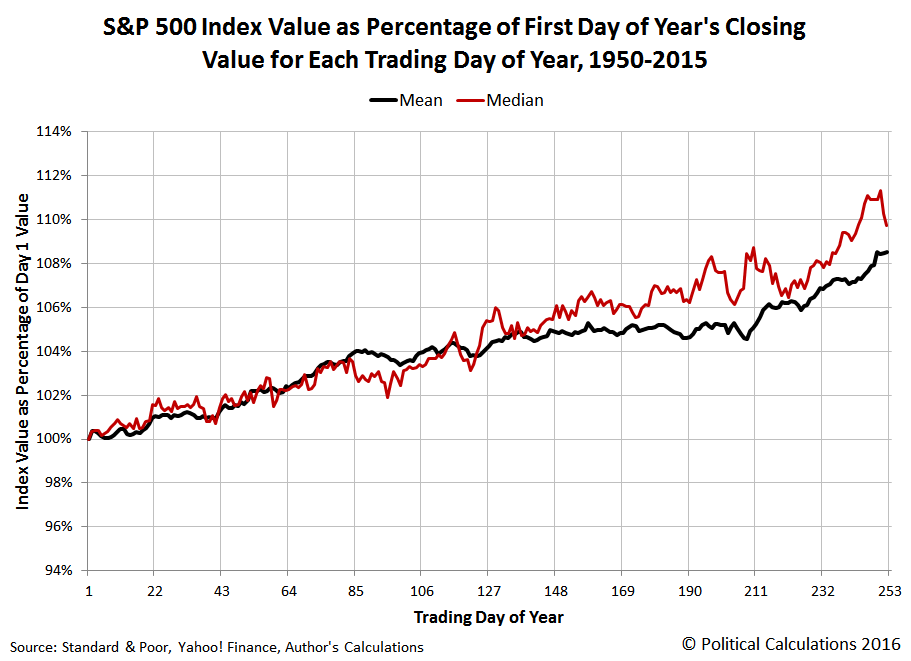
The median values shown above represent the actual values at the middle of the range of values we calculated for each trading day from 1950 through 2015. The average values reveal the extent to which abnormally strong or abnormally weak performances in particular years within the sample either pulled the mean trajectory above or below the median recorded value.
We'll leave it up to you to decide which is more "typical" of the historic annual trajectory of the S&P 500!
Disclosure: None.


