

Image Source: Pixabay
Why Are We Obsessed with 2% Inflation?
Financial media seems to be obsessed with 2% inflation, especially if the value is above it. A week does not go by without commentary about why inflation is not at that percentage or lower. Examining the Personal Consumption Expenditure (PCE) Price Index chart, the value has usually ranged between 0% and 2% since early 1998. Similarly, the United States CPI Core has been between that value since then.
That said, the Fed did not always have this target. The Federal Open Market Committee (FOMC) formally adopted the target in January 2012. However, the Fed resisted making the change for many years.
New Zealand was the first country to create a 2% target in 1988, followed by many others. In 2012, The Fed under Ben Bernanke pivoted, and the inflation target was set at 2%. This change was done under political pressure from legislation forcing the Fed to abandon its dual mandate.
Bernanke’s argument in his memoir was that a 2% target increases business and consumer confidence and provides the bank greater flexibility to address both parts of its dual mandate. The Federal Reserve still makes that argument. The website states, “inflation of 2 percent over the longer run, as measured by the annual change in the price index for personal consumption expenditures, is most consistent with the Federal Reserve’s mandate for maximum employment and price stability.”
However, the approach has a significant flaw. People argue that an employment rate target is needed, too, because the Fed has a dual mandate. A single target for inflation implies the Fed is overly focused on one part of its mission at the expense of employment.
Where does that put the United States today? The economy is performing exceptionally well, with an unemployment rate of 3.9% and a 2.5% inflation rate. Furthermore, the Gross Domestic Product (GDP) is rising, the dollar is strong, and the stock market is bullish. Consequently, do not expect to see changes to interest rates. They will likely be held constant for a while, again proving most economic and political forecasters wrong, like their predictions about a recession in 2023.
The Stock Market This Week
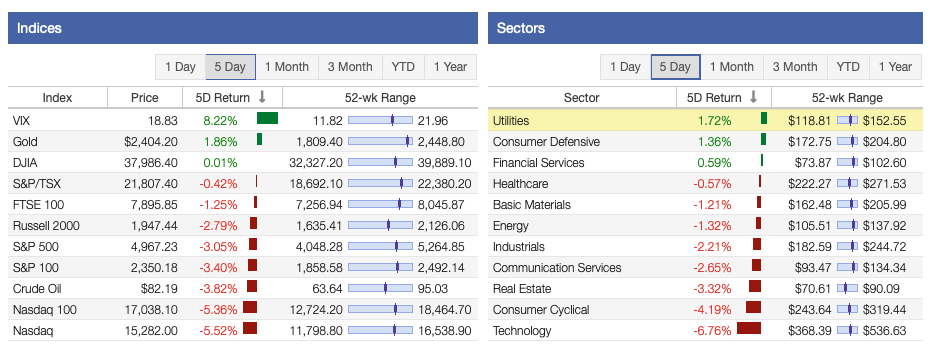
Recent data from Stock Rover illustrated a mediocre week for the stock market. All the main indexes were negative, except the Dow Jones Industrial Average (DJIA), which eked out a tiny, positive return. It was followed by the Russell 2000, the S&P 500 Index, and the Nasdaq Composite.
3 of the 11 sectors had positive returns this week. The Utilities, Consumer Defensive, and Financial Services sectors were the top performers for the week. However, the Real Estate, Consumer Cyclical, and Technology sectors were the worst performers for the trading period. Poor expectations for Apple, Tesla, and semiconductor stocks were hampering technology stocks.
Oil prices fell to ~$82 after a few weeks of gains. The VIX climbed 8%+ to 18.8 on geopolitical risks, which is above its long-term average. Gold ended the week at ~$2,404 per ounce. People often gravitate to the metal because of higher energy costs and geopolitical risks.
(Click on image to enlarge)
Image Source: Stock Rover
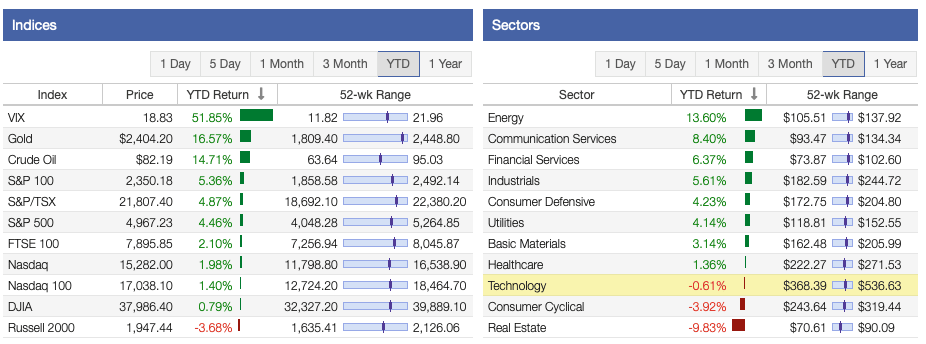
Despite the recent turmoil, the markets continued to move upward because of the strength of the American economy and the continuation of the bull market. The S&P 500 has been leading the way throughout the year, followed by the Nasdaq and the DJIA. Meanwhile, the Russell 2000 has seen a negative return year-to-date.
8 of the 11 sectors have seen positive returns thus far this year. The top performers in 2024 have been Energy, Communication Services, and Financials, while the Technology, Consumer Cyclical, and Real Estate sectors have been trailing overall.
(Click on image to enlarge)
Image Source: Stock Rover
Our dividend growth investing strategy started the year down. Overall, larger market capitalization stocks have been performing better than smaller ones. The table below shows their performance by category. However, it should be noted that dividends and passive income streams have continued to grow.
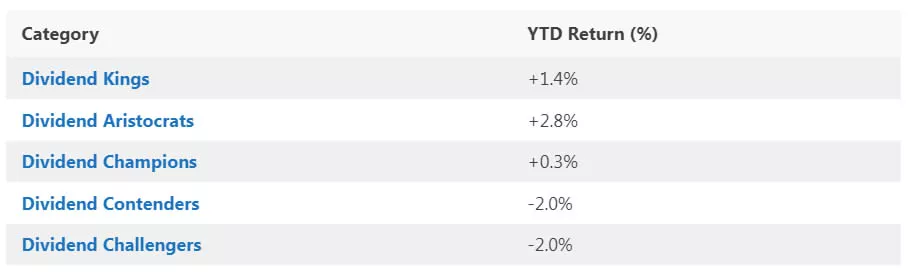
Image Source: Stock Rover
The Stock Market Valuation This Week
The S&P 500 Index trades at a price-to-earnings ratio of 26.96X, and the Schiller P/E Ratio is seen at about 32.98X. These multiples are based on trailing twelve months (TTM) earnings. The long-term means of these two ratios are approximately 16X and 17X, respectively.
Overall, the market is still overvalued despite the recent correction, the bear market, and the recent rebound seen in the markets. Earnings multiples of more than 30X are overvalued based on historical data.
More By This Author:
Stock Market This Week - Saturday, April 63 Dividend Growth Stocks For Spring 2024
What Is Unearned Income? Understand How It Works


Comments
Log in or sign up to join the conversation.