

It was a good and profitable week for those long in the market these past five and even nine days since the beginning of the year.
I have read one article and commentary after another stating that we’re surely in the beginning of a new bull market. Here are just a few of the comments (and charts) I have seen that state the S&P is behaving better and is "different this time."
- The 10-day ratio of advancing to declining stocks on the New York Stock Exchange was so strong it triggered the twenty-fifth breakaway momentum since 1949.
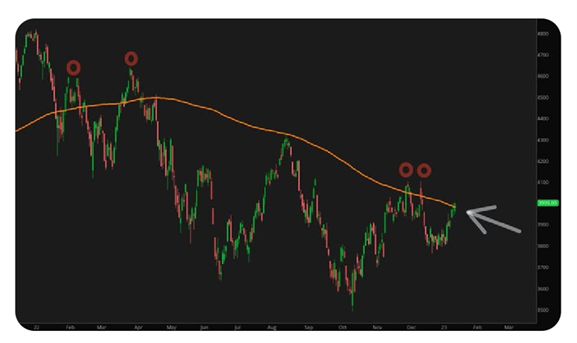
- The S&P closed above its 200-MA for the fifth time since the start of the 2022 bear market. The fifth time should be the charm.
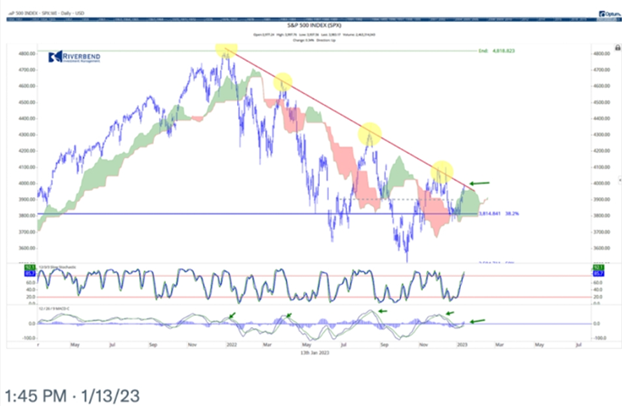
- The S&P reached its downward trend line, but something is different than previous times. We now have a fresh MACD buy signal.
-
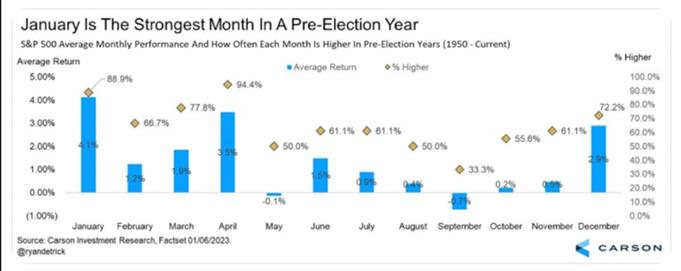
January is historically the best month during a pre-election year for stocks, up 4.1% on average. This bodes well for the whole year.
-
Inflationary pressures have subsided. Look at gasoline, the U.S. dollar, and interest rates. They are all giving the stock market some wind at its back (however, the equal weighted S&P has not gone anywhere).

Actually, I could go on and on because in a decent up trending market, similar to what we have experienced in the past nine trading days, everyone wants to get on board. It feels nice. For a change, the positive bias is welcome.
Plus, most of our algo-based strategies are ripping higher, and we are thrilled about that. For example:
- Large-cap leaders: +8.4%.
- GEMS: +6.6%.
- Nasdaq all stars: 7.9%.
- ETF sector plus: +8.9%.
Investors feel a sense of relief, and positive market daily closes put a smile on our faces and a little more energy in our step. However, it most likely will not last. And I have no desire to be negative or be a “Donny Downer.”
There are still too many potential economic issues in the way for a full out bull market. We think these short reprieves are clearly bull rallies in an extended bear market. At least, that is our opinion. Let me share with you just some of the issues that we are faced with currently:
-
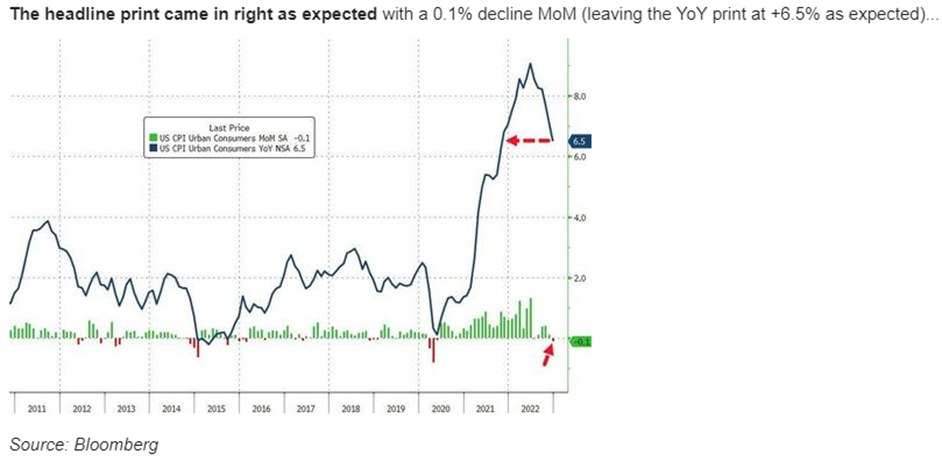
Persistent inflation. Inflation is not going to go away so quickly, no matter what you may hear. Last week, the CPI report came out and, yes, the monthly number had declined and, as expected, came in at -0.1% for the month. However, 12-month inflation was still high at 6.5%. This gives the Federal Reserve ammunition to continue raising rates to their target of 5.1%-5.25%.
Inflation is still high, and this is a continued negative for the stock market.
Note: I spent the last week doing business in Phoenix, and their media reported recently that the year-over-year inflation for Phoenix was not 6.5%, but instead 9.5%. Eggs in the valley went up 20% over the past two months alone. I suspect that this is pretty consistent with big cities around the U.S. Now that is persistent Inflation.
-
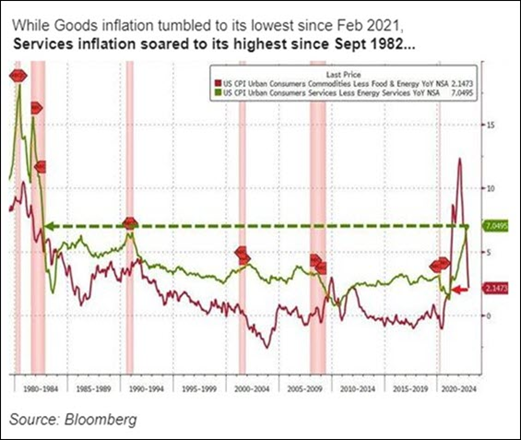
Services inflation came in much hotter than expected and at the most since 1982.
-
Real wage growth continues to decline.
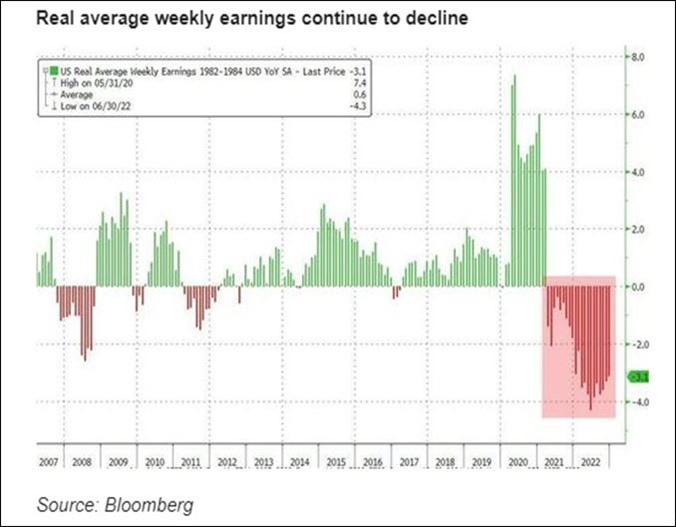
The above commentary and chart is the truest definition of stagflation. Stagflation and persistent inflation have been the mantra that our own Mish Schneider has been discussing and sharing with our readers and on television for better than 18 months. It is also what she discussed in her most recent 2023 Market Outlook that just came out.
Because of these hot numbers, not only does the Fed have a way to go, but they also have stated unequivocally that they do not see any reduction of interest rates in 2023 (i.e., no pivot). They have projected that their Fed lending rates may only come down to 4% in 2024. More importantly, they continue to drain liquidity from the system (selling bonds), and that will continue to create pressure on the bond market.
They remain steadfast in their hawkish desire to slow the economy and bring down inflation. In fact, there is such a hawkish tone coming from the Fed, that this past week the CEO of JP Morgan, Jamie Dimon, said he would not be surprised to see the Fed raise rates well past their projected target and all the way to 6.0% or higher.
These factors continue to put pressure on the stock market and may be negative for investors.
-
Earnings revisions should negatively affect stock prices and stock valuation multiples.
If you read some of our Market Outlooks during 2022, we spent a great deal of time discussing easy ways to calculate stock market values using earnings, interest rates, and multiples of P/Es. Earnings estimates are falling quickly, according to the chart below.

Original earnings looking out into 2023 were estimated to be around $220 a share. Then towards the end of 2022, the consensus opinion was that we might see them go as low as $200 a share. Just this past week, a number of analysts revised them downward, yet again, to a possible $190 a share.
We don’t know what they will come in as, but you should consider this: raw materials, labor costs, higher interest rates, along with the cost of distribution (trucking gas costs) and sluggish sales have all contributed to less profits and earnings being adjusted downward.
If you take an even $200 a share (for the year of 2023), which the market is currently pricing in and assign different multiples, here is what might be fair market valuations:
- $Earnings x Multiple = S&P 500 Price.
- $200 x 15x (P/E) = 3,000.
- $200 x 17x (P/E) = 3,400.
- $200 x 20x (P/E) = 4,000.
The higher interest rates rise, typically, the lower multiples will go, especially if higher interest rates actually cause a mild recession in the first half of 2023. Your guess is as good as mine about where the market is priced.
However, let me say that Mike Wilson, the Chief Investment Strategist for the behemoth Morgan Stanley, came out this week and did the same arithmetic as we did above, and his conclusion was that the market could (and should) get to 3,000 before it gets to new highs. (We don’t know if he is right, but he sure nailed where the market was headed in 2022).
Recently, one of our avid readers told me that I am too negative. I get it. However, I have friends and clients of other money management firms that are down more than 20% in 2022. I hope our warnings, cautionary commentary, and overall suggestions may have saved you from being hurt in 2022.
If not, or if you would like to discuss the MGAM optimal investment blends that beat their respective benchmarks by 2x or more over the past five years, please email Keith or me and let’s have a friendly discussion about your investment goals and objectives.
At the Tipping Point
The “experts” on television are endlessly debating about whether or not we are going to have a “recession” this year, and meanwhile, economic activity is imploding all around us.
The number of homes being sold in this country each month has already fallen by a third. The number of job cuts in November was much higher than it was during the same month a year earlier, and at this point, even Amazon is laying off thousands of workers. The Federal Reserve has declared war on inflation, but prices continue to spiral out of control. In fact, vegetables are 80% more expensive now than they were 12 months ago.
The following are a few signs that the economic “tipping point” that everyone has been waiting for has now arrived:
- Manufacturing is declining at the fastest pace since the early days of the COVID-19 pandemic.
- The S&P Global U.S. Manufacturing Purchasing Managers’ Index (PMI) fell at the fastest rate since May 2020 in December, a continuing sign that the manufacturing sector is on the decline. S&P Global reported on Tuesday that the U.S. services PMI has now fallen for six months in a row.
- We just witnessed the largest one-day drop in the Baltic Dry Index since 1984. The Baltic Exchange’s dry bulk sea freight index crashed on Tuesday in the worst decline on record, sinking on prospects of a global recession. The Baltic Dry Good Index is a measure of global shipping and economic health. The overall index, which tracks rates for capsize, Panamax, and Supramax shipping vessels carrying dry bulk commodities, plunged 17.5% to $1,250, the most significant daily decline since 1984.
- Thanks to rapidly falling imports, we just witnessed the largest monthly decline in the trade deficit since the last financial crisis.
- The debt ceiling needs to be raised, and that could be an issue on Capitol Hill, resulting in a default and a downgrade of U.S. debt.
- In 2022, U.S. auto sales were the lowest that we have seen for a full year in more than a decade.
- The average rate on a 30-year fixed-rate mortgage is more than twice as high as it was this time last year.
- According to CNN, sales of apartments in Manhattan were 28.5% lower in the fourth quarter of 2022 than they were in the fourth quarter of 2021.
- Overall, existing home sales in the United States have fallen for 10 months in a row and are now down by more than a third since January 2022.
- Multiple companies have reported they are on the verge of bankruptcy, including Bed Bath & Beyond and Carvana to name a few. Bed Bath & Beyond warned last week that it’s running out of cash and is considering bankruptcy.
- Numerous large companies, including Amazon, Google, Facebook, and others are laying off employees. It is reported that Amazon is laying off more than 18,000 employees - the biggest reduction in its history. It is also reported that the tech industry has already laid off more than 150,000 workers over the last year.
Remember, this is all sanctioned and endorsed by the Federal Reserve who needs to see continuing signs that the economy is slowing and layoffs are a necessary part of the damage higher interest rates cause. This is by design. These actions and reactions are part of the Fed’s effort to slow down inflation and get it close to the target of 2% annual inflation.
This is not a recipe for a bull market. The stock market historically has bottomed when we enter a recession. We are not yet in one and it may be some time before the aforementioned economic weakness actually results in a recession. Be careful out there, this may only be a short-term rally.
Risk On
- This week’s price action was very strong, with the Dow Jones (DIA) extending its bullish phase and the Nasdaq Composite (QQQ) improving into a recovery phase, and the Russell 2000 (IWM) moving into an accumulation phase along with the S&P 500 (SPY).
- IWM moved into a bullish phase on the weekly charts.
- Volume patterns improved for all the indices, with four accumulation days in each index over the past two weeks.
- The riskiest sectors, such as consumer discretionary (XLY) (5.8%) and semiconductors (SMH) (6.7%) over the last five trading days were up the most, and defensive sectors like consumer staples led to the downside with 1.4% losses for the week.
- Other sectors like solar (TAN) and clean energy (PBW) were up by 10.6% and 14.8%, respectively, along with metals and miners and oil-related services, which led over other sectors, indicating risk on sentiment.
- The McClellan Oscillator is showing a huge upthrust short-term for the Nasdaq and NYSE, and it has not displayed these high levels since June 2022.
- The Cumulative Advance-Decline line also broke out over December’s swing high.
- The 52-week new high-low ratio for the NYSE and Nasdaq continued to improve.
- The Hindenburg Omen warning flash from mid-December is no longer indicating a potential crash.
- Volatility spreads improved between short-term volatility and longer-term volatility, and they moved above the 1.0 level, indicating volatility has declined.
- Looking at stocks above key moving averages, we had significant improvement on all indices, all with positive slopes, and positively stacked.
- In terms of interest rates, they are recovering across all time frames, indicating some potential easing in rates across the board.
- Small and mid-cap stocks have gained strength over large-cap stocks along with value stocks (VTV) outperforming growth stocks (VUG), and this is another indication of risk-on sentiment.
- The Modern Family Index continues to recover. Five of the Six Modern Family Members are either in accumulation phases or a bullish phase, like biotech (IBB), which indicates a risk-on environment.
- Foreign equities received a tailwind from China (EEM) and large-caps, and EFA remains in a confirmed bullish phase.
- Gold looks explosive and continued to climb higher in a confirmed bullish phase on the weekly charts.
- Looking at the U.S. dollar, it remains under pressure. The U.S. dollar is at six-month lows, breaking down to a warning phase on the weekly chart and potentially transitioning into a bear phase on the daily chart.
Neutral
- The risk gauges remain neutral due to gold outperforming and long U.S. treasuries outperforming high-yield debt. The gauges have not deteriorated, but they have also not improved.
- Base metals were very strong, including copper leading the way with price outside the Bollinger bands and real motion indicating it being potentially overbought.
- DBA found support at the bottom of its trading range after becoming oversold.
Bearish
- The yield curve remains sharply inverted, and high yield debt is still underperforming U.S. long bonds.
More By This Author:
What's In Store For 2023?Fair Warning! Looking Forward Into 2023
October Was Not So Scary After All - Things To Keep A Watch Out For


Comments
Log in or sign up to join the conversation.