
The S&P 500 In Week 2 Of November 2016
The second week of November 2016 was everything a bored market watcher could hope for, and more! Unexpected news: check! Massive swings in intraday daily stock price volatility: check! Blown prediction about Week 2 of November 2016: check!
Or was it? You be the judge....
Halfway through our hand-drawn forecasting experiment, the actual trajectory of the S&P 500 is running to the low side of our forecast range, which we think will continue in the absence of a noise event (there's an election in the U.S. sometime next week, right?) or a more fundamental change in the expectations for the future with respect to the S&P 500's dividends.
Well, we certainly got a noise event! Here's how things stand on our alternative futures chart, where four weeks ago, we projected that the closing value of the S&P 500 on each trading day would track along in the red-shaded area indicated on the chart, at least in the absence of a significant noise event or a more fundamental shift if the future expectations of investors.
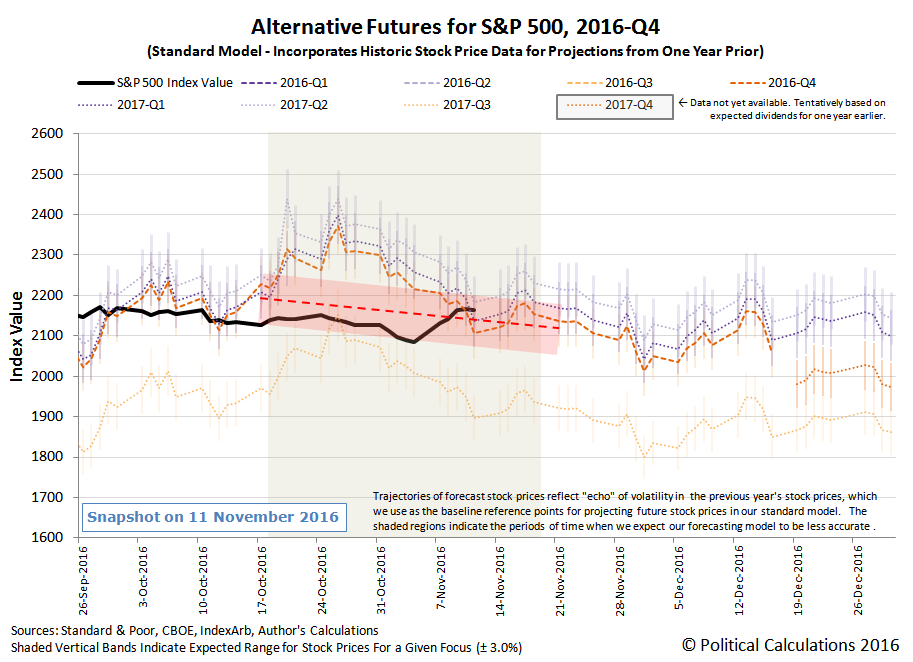
![]()
We've got one week to go before our red-shaded forecast expires. Who knows what other noise we might see before the next week is over?
Speaking of which, here are some of the headlines that captured the "fun" of Week 2 of November 2016.
Monday, 7 November 2016
- Stocks, dollar jump as FBI clears Clinton in email probe - the S&P 500 closed at 2131.52.
- The election ate their homework? CEOs blame campaign for weakness
Tuesday, 8 November 2016
- Fed's Evans says not yet confident US inflation headed higher - also On election day, Fed official urges U.S. fiscal investment, and Fed rate hike in December looks 'reasonable': Evans
- Before the bell: Oil retreats with rattled stocks as voting starts in U.S. polls - After the close: Oil prices edge higher with Wall St as the U.S. votes - the S&P 500 closed the day at 2139.56
- Wall Street climbs as investors bet on Clinton triumph
Wednesday, 9 November 2016
- Wall Street elite stunned at Trump triumph
- Investors see no let up to market bloodbath if Trump wins presidency
- The now immortal words of Paul Krugman: "If the question is when markets will recover, a first-pass answer is never."
- US STOCKS-Futures tumble as Trump opens path to White House
- Wall Street surges after Trump wins White House
- The S&P 500's thinly traded futures dropped to a low of 2028.15 (over a 111 point, or 5.2%, decline from the previous day's closing value) around midnight on 8 November 2016, then began rebounding. By the end of the regular trading day on 9 November 2016, the S&P 500's closing value was 2163.26 (a 23 point, or over 1% gain)! See here and, more surprisingly, here, for a hypothesis of why that remarkable result came to be!
Thursday, 10 November 2016
- Fed's Williams says gradual rate rises still make sense
- Fed still due for single rate hike, then hold: St. Louis Fed's Bullard
- Oil slips as focus moves from Trump to oversupply
- Wall Street ends higher, helped by banks, industrials
Friday, 11 November 2016
- http://www.reuters.com/article/us-usa-fed-fischer-idUSKBN1361FK
- Oil down 2 pct on OPEC glut worries; U.S. rigs up by two
- Expected inflation pop from Trump win pushes dollar to best week in a year
- Keep in mind that the Fed has been consistently trying to get higher rates of inflation in the U.S. economy with precious little success since 2012.
- Dow ends at record high; indexes post sharp gains for week
As always, Barry Ritholtz divided the week's economic and market news into its positives and negatives.
Disclosure: None.

Comments
 No Thumbs up yet!

