
The S&P 500 In Week 1 Of November
The first week of November 2016 ended with a whimper, even though the S&P 500 fell for the ninth consecutive day - something it hasn't done since 1980! (See our post from last Friday, "Will the S&P 500 Make It 9 Losing Days in a Row?", for more on our thoughts on the likelihood of such an event and also a tool you can use to find out how likely 10 down days in a row might be!)
We were also two-thirds right in our prediction from the end of Week 4 of October 2016, where we wrote that:
In the absence of other such noise events, or more fundamental factors that could seriously influence stock prices, we can reasonably expect stock prices in the near future to converge with the trajectory we sketched on the chart above. After that happens, stock prices will more likely than not resume their generally downward trajectory, although the only thing we would really expect is that they fall somewhere within the shaded range we've indicated on the chart above.
Here's an updated version of last week's chart....
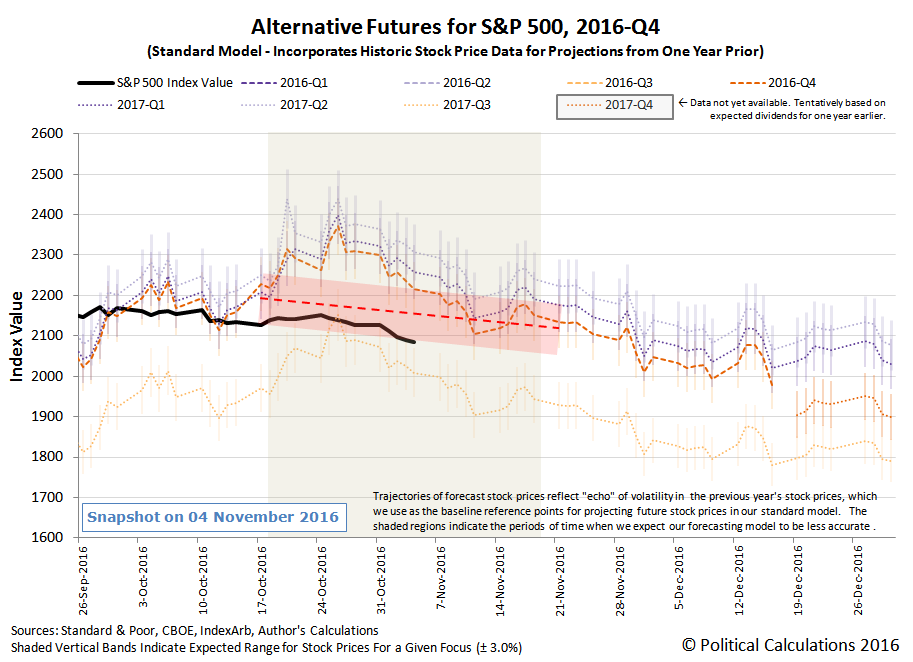
![]() The two of three parts we got right:
The two of three parts we got right:
- The actual trajectory of stock prices did move to converge with the trajectory we sketched on the chart on Monday, 31 October 2016.
- After that happened, stock prices resumed their generally downward trajectory.
The part we got wrong is that stock prices just ever so slightly dropped out of the red-shaded range we indicated on the chart on Thursday and Friday of Week 1 of November 2016, which if we had been more deliberate in drawing it three weeks ago, we would have drawn to be slightly wider so that it extended 3% above the red dashed line and 3% below it - just like all the other ranges about the alternative trajectories we showed on the chart....
Still, our policy is that near-misses are still misses, as we're neither playing horseshoes or the slots at Vegas!
Halfway through our hand-drawn forecasting experiment, the actual trajectory of the S&P 500 is running to the low side of our forecast range, which we think will continue in the absence of a noise event (there's an election in the U.S. sometime in this next week, right?) or a more fundamental change in the expectations for the future with respect to the S&P 500's dividends.
Until next week, here are the headlines we made special note of during the first week of November 2016.
Monday, 31 October 2016
- Oil ends at one-month low on OPEC doubts, expected record output
- Wall St. ends flat amid election doubts, M&A flurry
Tuesday, 1 November 2016
- Oil ends down but off lows, then slides on API report
- U.S. election, rate uncertainty rattle Wall Street
Wednesday, 2 November 2016
- Oil prices tumble 3 percent on record U.S. crude build - oil was down for the fourth day in a row.
- Before the bell: Wall St. falls as election uncertainty rattles investors - After the bell: S&P 500 falls for seventh straight session - seven consecutive down days in the S&P 500 has happened just 24 times since 3 January 1950!
- Fed holds rates steady, sets stage for December hike
Thursday, 3 November 2016
- Oil prices dip down on inventory boost, OPEC skepticism
- S&P 500 losing streak runs to 8 days as Facebook weighs - eight consecutive down days has only previously happened just 10 times since 3 January 1950!
Friday, 4 November 2016
- Atlanta Fed's Lockhart says U.S. rate increases to be 'very' gradual
- In the morning: S&P on track to snap longest losing streak since 2008 - After the close: S&P 500 falls for ninth straight session
Elsewhere, Barry Ritholtz categorized the week's economic and market news into its positives and negatives.
Disclosure: None.


