
The Potential SPY Bounce Will Be Limited

Image Source: Pexels
SPX Monitoring purposes; Sold 4/9/25 at 5456.90= gain 9.52%;Long SPX 4/8/25 at 4982.77.
Our gain 1/1/24 to 12/31/24 = 29.28%; SPX gain 23.67%
Our Gain 1/1/23 to 12/31/23 SPX= 28.12%; SPX gain 23.38%
Monitoring purposes GOLD:Sold long GDX 4/11/25 at 49.66 = gain 21.33%.
(Click on image to enlarge)
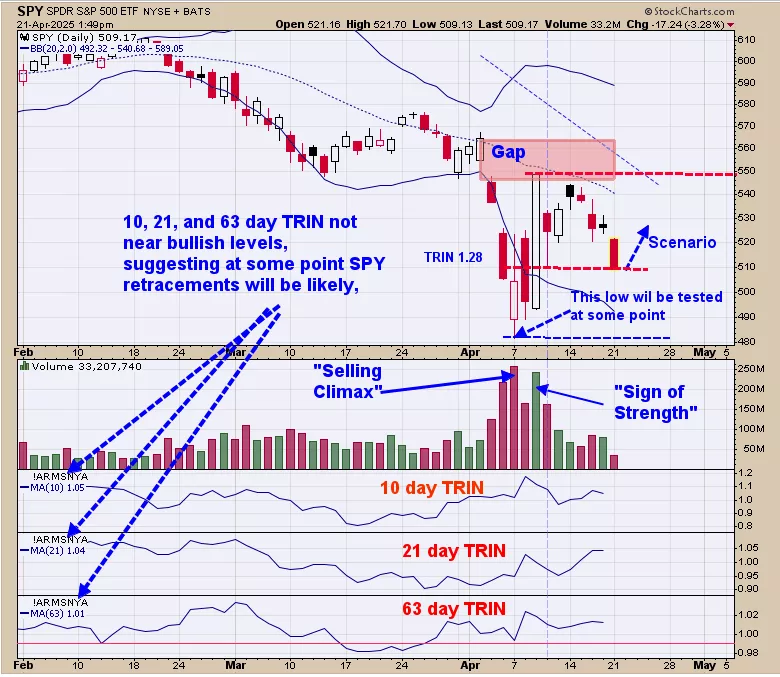
We ended up 29.28% for 2024; SPX up 23.67% for the year. Looking at the volume chart; we have a “Selling climax” on April 7 and a “Sign of Strength” on April 9; which are two necessary requirements for producing a bottom. What that means is that the market may have started a basing pattern and that the downtrend is ending. Most likely the “Selling Climax” April 7 low will be tested at least once before the uptrend begins. Today’s trading tested the April 10 low on lighter volume suggesting support. However the TRIN moving averages are not at bullish levels suggests the potential SPY bounce will be limited. Staying neutral for now.
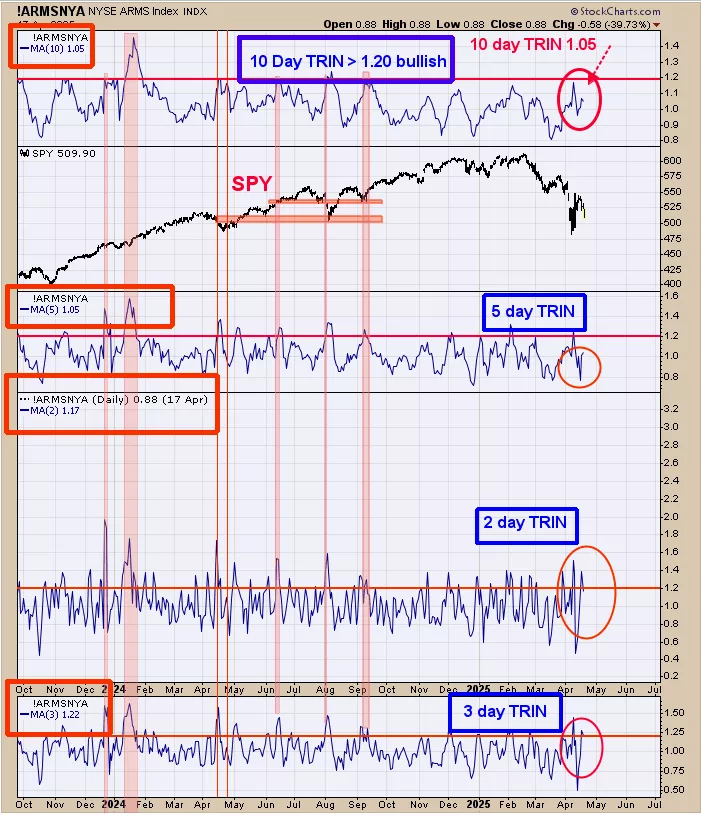
The top window is the 10 day TRIN which stands at 1.05 and neutral; needs to be near 1.20 or higher for bull case.The 10 day TRIN of 1.20 show panic and panic forms near lows.Next lower window is the 5 day TRIN with a reading of 1.05; Neutral; next lower window is the 2 day TRIN with a reading of 1.17 and leans bullish; and bottom window is the 3 day TRIN with a reading of 1.22 and bullish. The 2 and 3 day TRIN has reached near bullish and bullish levels but are the least important because of the short duration. When the 10 day TRIN closes near 1.20 and higher will be the time where a extended rally can begin.

We are thinking this chart is an interesting chart. Above is the monthly HUI/NDX ratio (middle window); bottom window is the monthly NDX and top window is the monthly HUI.Referring back to the monthly HUI/NDX with its RSI above it; we noted a 12 year cycle red line which last time came in late 2024.When the monthly HUI/NDX ratios is rising, than HUI is outperforming NDX and vice versa.When the monthly HUI/NDX is rising and the RSI in general stays above 50 (noted in shaded green) and when HUI/NDX is falling than in general the RSI stays below 50 (Noted in shaded pink).Right now the RSI stands at 65.96 showing that HUI is outperforming NDX and a reading above 60 kick in the idea another up-leg in this ratio has started.What this chart suggests is that another 12 year cycle has started where HUI will outperform the NDX.
More By This Author:
"Three Drive To Top"A “Three Gap Play”
Gold May Get Stronger In The Coming Weeks
Signals are provided as general information only and are not investment recommendations. You are responsible for your own investment decisions. Past performance does not guarantee future performance. ...
more

