
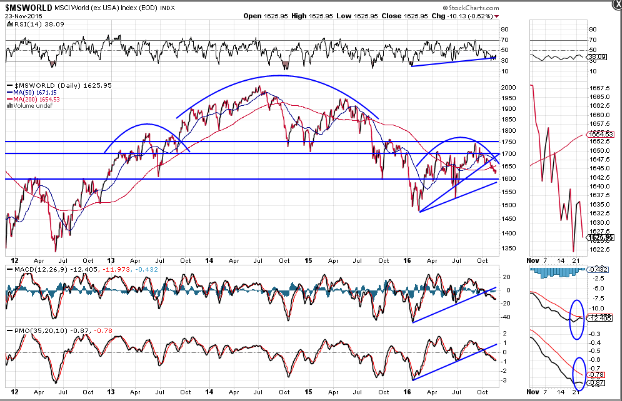
The Plight Of The World Market Index
As can be seen on the following Daily chart of the World Market Index, the price has fallen below both the 50 and 200 MAs and is, once again, nearing a critical major support level of 1600.
Even though the price is trading under the bullish influences of a moving average Golden Cross, all three technical indicators are hinting of further weakness to come.
Watch for a bullish crossover of the MACD and PMO indicators, as well as a price reversal and bounce, break, and hold, firstly, above 1700, then above 1750, as a potential signal of clear support of higher prices for world equities, in the longer term, including that of the SPX. Conversely, a break and hold below 1600could very well forecast a large downdraft for all world equities in the near term.
(Click on image to enlarge)


Thanks for your sharing. Merry Christmas to you and family in advanced