
The Next Financial Crisis – Part I
Protecting Yourself with Gold, Oil and Index ETF’s
In 2009 I shared my big picture analysis, investment forecast and strategy in a book called “NEW WORLD ORDER ECONOMICS – What you can do to protect yourself”. In January 2009 I forecasted that the Dow Jones Industrial Average was going to make a bottom within a couple months which it did. I also predicted the price of gold to start another major rally, and for crude oil to bottom and rally for years, which were also correct.
You can call it luck, skill or a mix of both… but the truth is that the markets cannot be predicted with 100% certainty. With that said, the US stock market, gold and oil look to be setting up for their NEXT BIG multi-year moves.
US Equities Bull Market Is About To End
2014 was a tough year for small cap stocks. The Russell 2000 index which is a great barometer of what speculative money is doing as a whole. History has shown that small capitalization stocks are the first group to show weakness after a multi-year bull market.
For all of 2014 this group of stocks has been struggling to hold up. Each time it nears a previous high, sellers come out of the woodwork and unload shares in large volume. This was the first tell-tale sign that institutions are starting to rotate their positions out of these high beta stocks.
Later that year in October 2014 the S&P 500 fell 10% in just a few weeks. The speed of the selloff and the heavy volume that accompanied it are yet another warning sign that the underlying strength of the stock market is weakening. This broad market selloff included the large capitalization stocks which means the end is nearing.
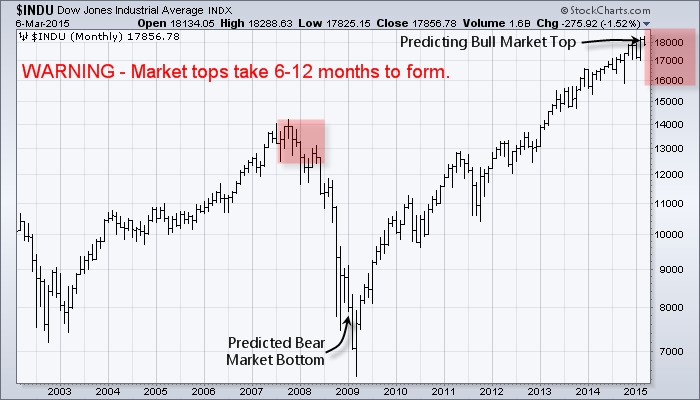
If we turn our focus to the Dow Jones Industrial Average and look at the chart below you will see my prediction for 2015/2016.
I should be clear on what to expect during market tops because they differ than market bottoms. Most bottoms that occur are powered by fear. And fear has a price pattern on the chart that is much different than what we see during market tops when optimism is high.
Bottoms tend to be more violent with large range bars and the process happens in half of the time than what a bull market top requires.
Bull market tops take longer to form and for price to actually breakdown and confirm it’s headed lower. My thinking is that a market top may have already started. The underlying metrics are eroding and the heavy volume selloff in Oct 2014 was the first major signal that big money is selling.
I do feel the market as a whole can and will make some minor new highs, but will have strong bouts of selling shortly after. Late 2015 and going into 2016 is when the US stock market will likely start to get volatile and we will see the first MAJOR drop in value. It will be similar to the first breakdown bar that took place Jan 2008. A 15-20% drop that breaks the Oct 2014 low is going to be the straw that breaks the camel’s back.
Once we get the initial break in price the market should pause or bounce for a few months as investors are still overly bullish at these BARGAIN prices “they think” and buy more shares. In reality it’s the worst thing an investor can do at this stage of the stock market life cycle.
Once the bear market starts investors should expect 12-24 months of lower and sideways price action.
So How Do We Take Advantage Of This?
There are two ways to play the next bear market. First is to simply move your money out of stocks. This means sell long positions, pull money out of mutual funds etc… and just hold your money in cash. Cash is king and by doing this you will retain your current level of wealth and be ready to invest when the time comes later in 2016/2017.
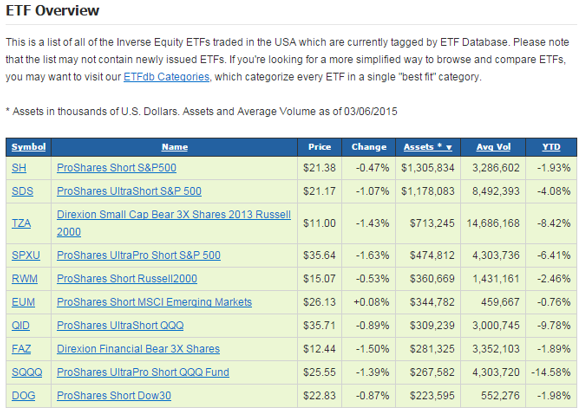
The second option is to do the same as above but to put a portion of your money to work in a way that will allow you to profit from a falling stock market. That is to invest in ETFs specifically inverse funds.
Inverse funds rise in value as the stock market price falls. For example if the Dow Jones Industrial Average drops 35% over the next 24 months, your investment would rise 35%, 70% or even 105% depending on the type of fund purchased.
Below are some ETFs that can be used to take advantage of the next bear market
Part 1 Conclusion:
In this article we talked about how the US stock market is showing signs of a major top being put in place later this year. And in the next article PART 2 I will who you what to expect long term for crude oil and how to play this multi-year cycle.
>> Read Part II: The Next Financial Crisis
Join My Free Newsletter at www.GoldAndOilGuy.com, and please ...
more


Likely to happen, SDS is my only equity in the us..