The Medium-Term Trend - Wednesday, June 28
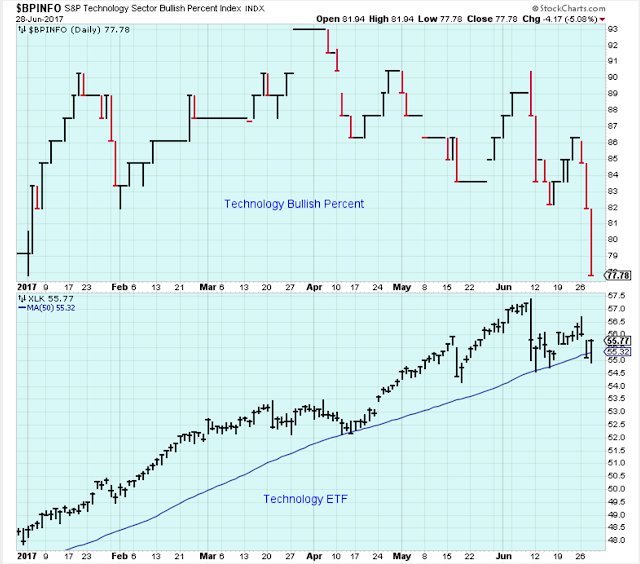
It seemed as though some of the selling pressure on Technology was reduced with today's rally. But this chart of the Technology bullish percent indicates that many stocks in this index showed weakness. It looks like we had a counter rally today in a larger downtrend for Technology.
The Medium-Term Trend
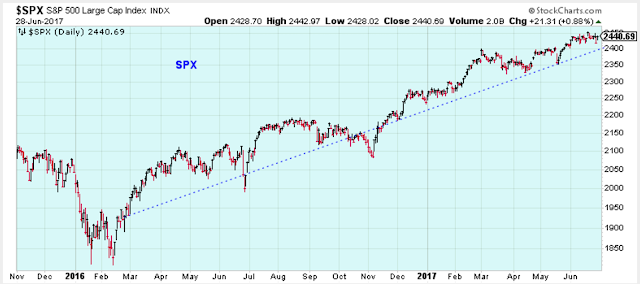
This trend looks unstoppable.
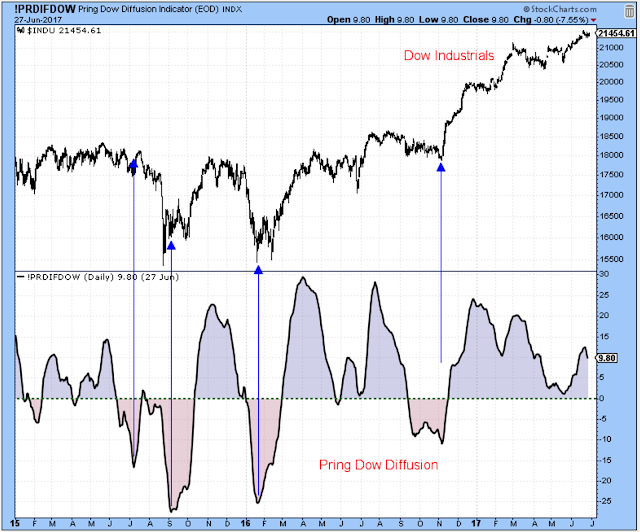
This indicator shows some hope for the bears.
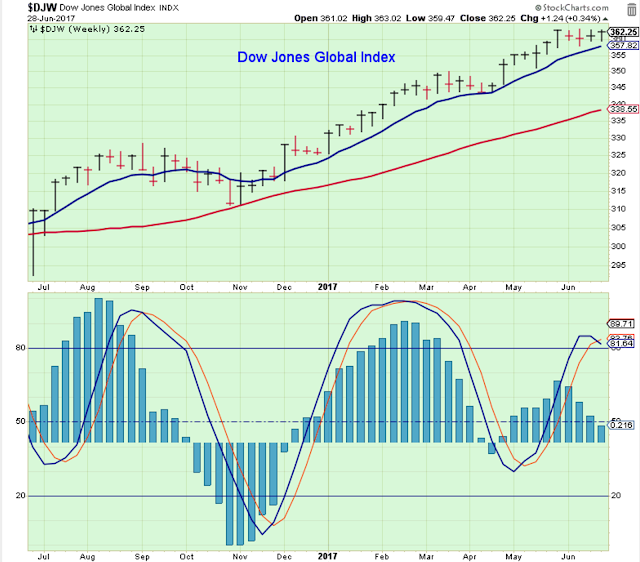
The world index might be breaking out from yet another base, but then again the momentum is weak.
Bottom Line:
This market just keeps going up and up. None of the charts that I monitor have much more to offer than they did earlier in the year. Every negative blip in an indicator seems to be a just a pause before the next move higher in the major indexes.
We all know there will be a correction at some point, but when? Also, it is a 10-year old bull market. They don't last forever.
I don't like it. I am slowly increasing the level of cash in my accounts.
The Leader List
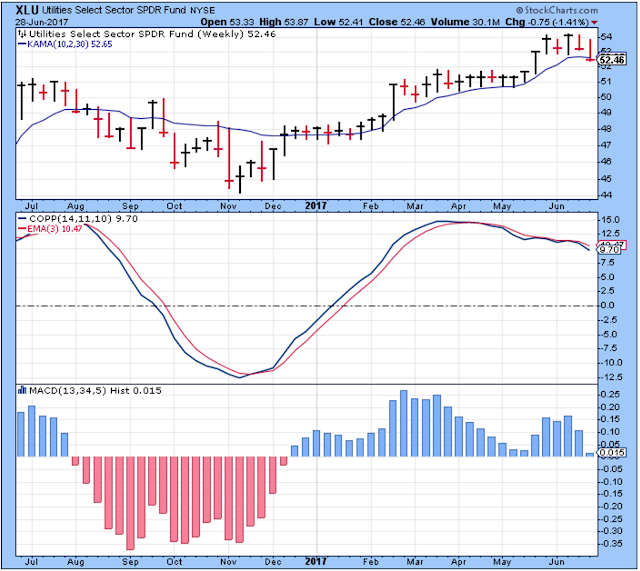
Utilities looked weak today.

This weekly chart of Utilities shows it dropping under the moving average along with some weak momentum.
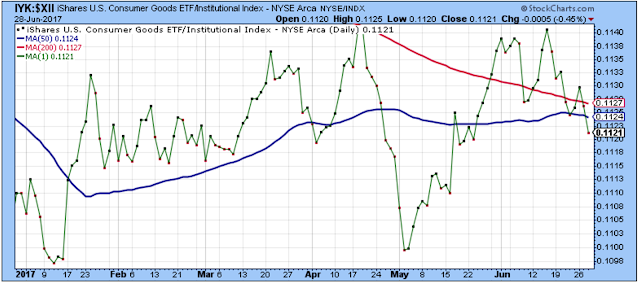
Consumer Goods are showing relative weakness,
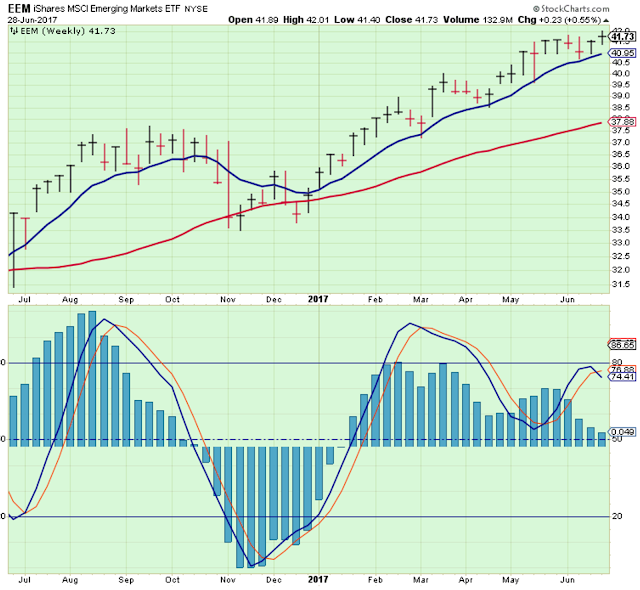
The technicals for EEM have improved, but I am not sure if this chart shows an ETF rolling over or about to pop out above a new base. Either way, it looks extended to me.
Outlook
The long-term outlook is positive.
The medium-term trend is up. Overdue for a medium-term correction.
The short-term trend is ... not sure.
Disclaimer: I am not a registered investment advisor. My comments above reflect my view of the market, and what I am doing with my accounts. The analysis is not a recommendation to buy, ...
more


Thanks