
The Market Finds Footing
- SPX Monitoring purposes; Long SPX on 3/8/19 at 2743.07.
- Monitoring purposes GOLD: Long GDX on 1/29/19 at 21.96.
- Long Term Trend SPX monitor purposes; Long SPX on 10-19-18 at 2767.78
(Click on image to enlarge)
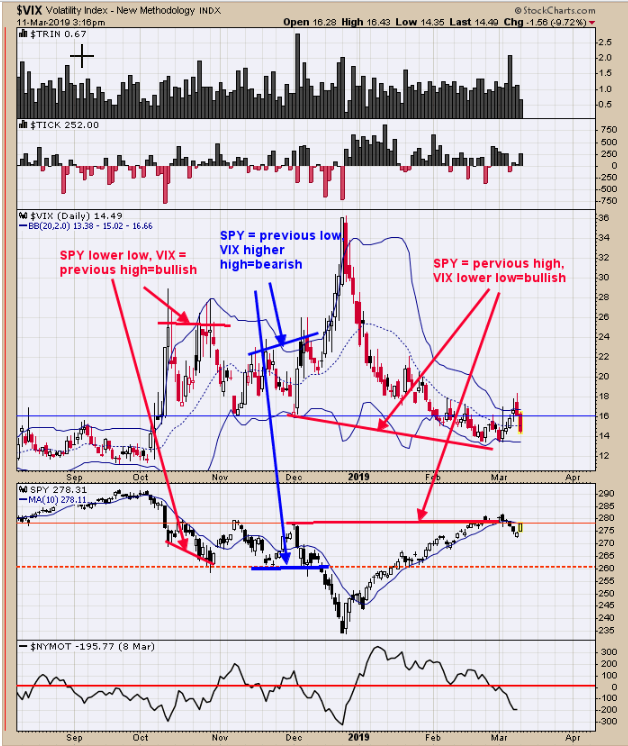
The VIX trades opposite the SPY. It is common for the VIX to lead (in the opposite direction) the SPY. Notice that the SPY tested its November and December highs and VIX broke below its November and December lows suggesting at some point the SPY may break above its November and December highs. Will the SPY break above the November and December highs on this current run, we are not sure but it could. We pointed out the last two times where the VIX was giving a divergence and both times proved successful signals.
(Click on image to enlarge)
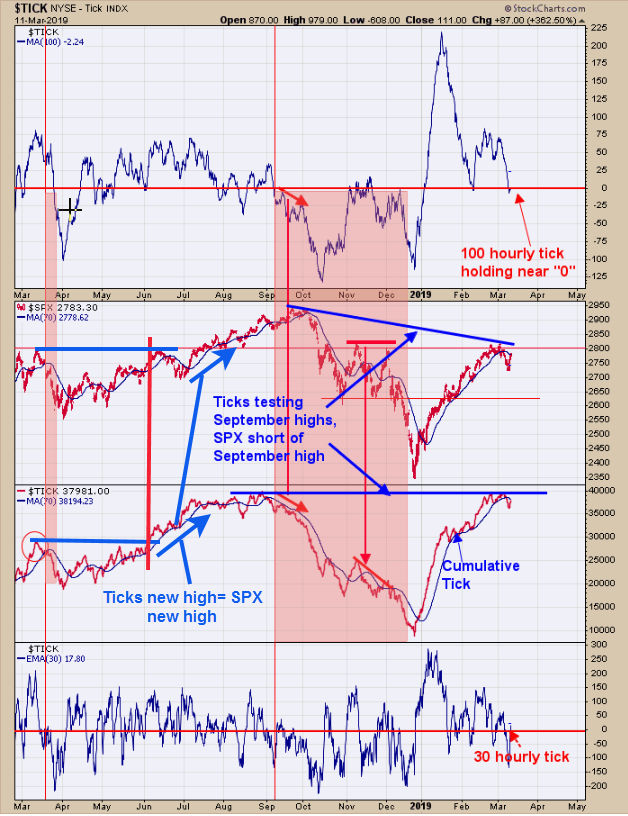
It's common for the ticks to lead SPX as it is for the VIX to lead SPX. Back in June 2018 the cumulative tick hits a new high and continues higher, where SPX tests a previous high and consolidates for a couple of weeks. After the short SPX consolidation, the market finds footing and hits new short term high just as cumulative tick suggested. The cumulative tick has tested its September high and so for the SPX is still below its September high. The cumulative tick is remaining short term resultant suggesting the SPX may continue higher and possible tests its September high. If the Cumulative tick breaks above its September high on the current run, it will add to the bullish scenario. On the other side of the coin, if the cumulative tick weakens on the current rally than that would be a bearish sign.
(Click on image to enlarge)
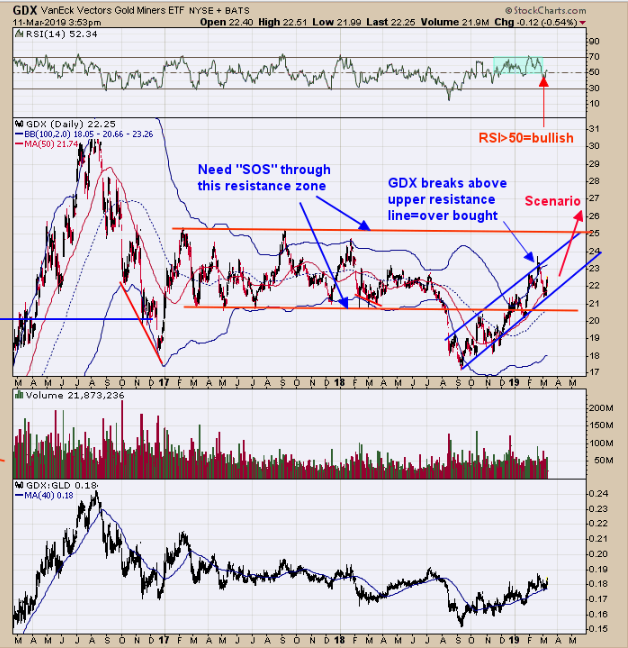
GDX was in a trading range in 2017 that spanned from 21.00 to 25.00 range. In 2018 it fell below the 21.00 support in mid-year and then closed above 21.00 in late December creating a bullish “Shakeout”. It is said, “if a market can’t hold below its previous low, it will attempt to take out the previous high”. The previous high, in this case, is the 25.00 GDX range and that is our upside target for now. We have drawn “Channel” lines of which GDX is following and the upper “Channel” line reaches 25.00 in late April or Early May. The monthly Chart remains on a buy signal and we are expecting the market to move higher in the coming weeks. Long GDX on 1/29/19 at 21.97.
Disclaimer: Signals are provided as general information only and are not investment recommendations. You are responsible for your own investment decisions. Past performance does not guarantee future ...
more


Nice to see, thanks.