
The Longer-Term Trend Is Positive
The longer-term outlook is positive.
Bob Brinker said it best, "stock prices are supported by the lack of any signs of a recession."
The chart below shows that breadth and moving averages are confirming stock prices at new highs.
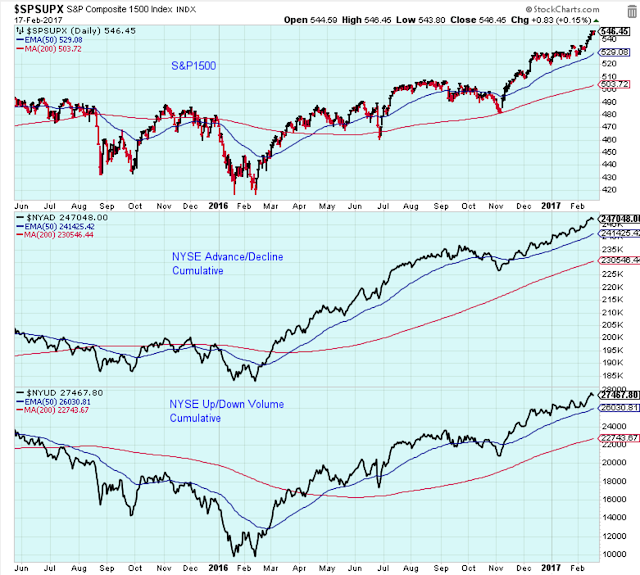
The Dow indexes are nicely aligned and pointing higher which favors stock prices.

The 50-day average of new 52-week highs has stalled a bit and shows a lower high. Do we have the beginning of another negative divergence?
It doesn't look too bad yet. Maybe more of a short-term issue to be resolved soon.
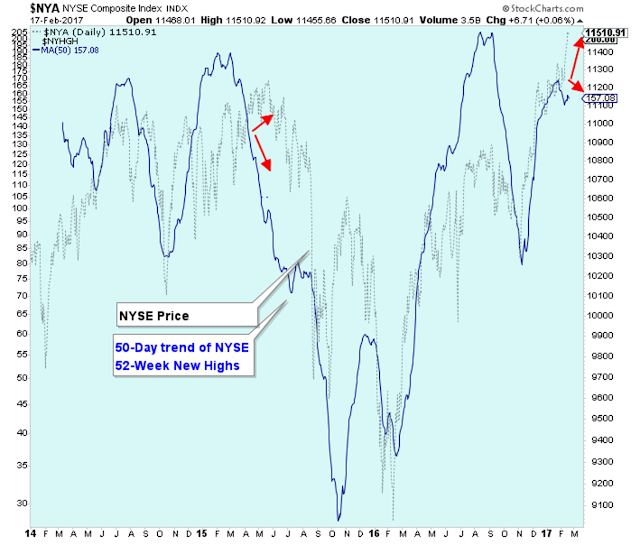
Longer-term, this chart looks favorable for stock prices, but shorter-term the chart is pointing to some weakness.
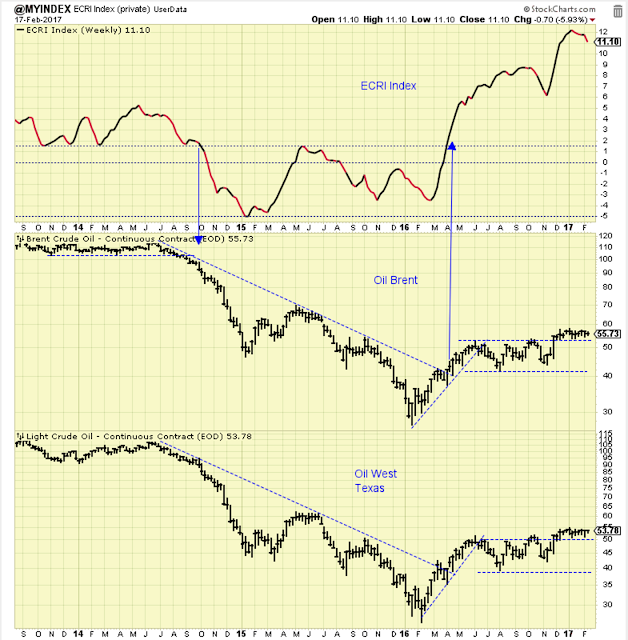
The ECRI index can't go higher forever. At some point it had to start to level out, and finally it seems to have started.
Small caps are very healthy, but extended too? They need to retest the uptrend line.
M2 growth has slowly diminished over the last 12 months, and it is now pressing against the lower bounds. But it is still within the middle of the range.
Let's not over think this. These indicators look good longer-term, but could use some consolidation shorter-term.

Oil prices remain not too hot, and not too cold. This favors the stock market.
Bottom line: I don't see anything in the charts to threaten the long-term uptrend in stocks, but there are a few blips that might hurt stocks short-term.
The Short-Term Trend
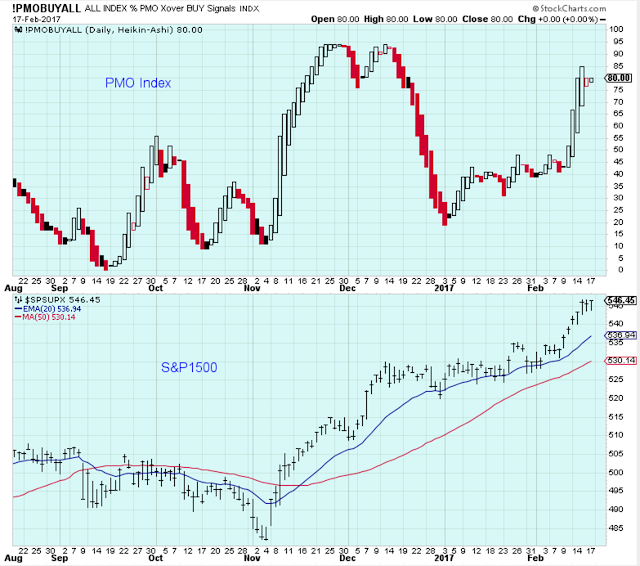
We are on watch for a top in the short-term cycle. The PMO and prices have stalled for a couple days.
A pullback or consolidation would not surprise anyone, but it is more important to watch for a breakdown below the 50-day such as early September 2016.
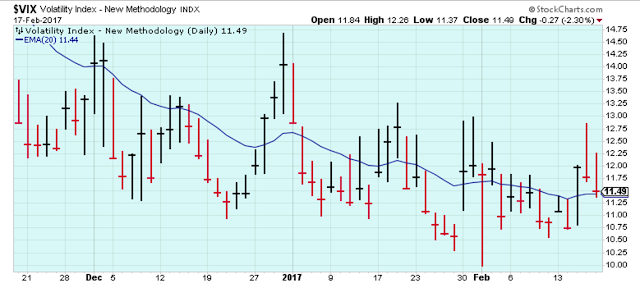
We had a bit of spiky behavior in the VIX the last few days. With the PMO at the peak and prices so stretched, this jumpy VIX is to be expected.
But with the VIX closing at the lows the last few days, I am not sure how much to make of this. Plus, I am no expert on the VIX. I just watch it for divergences when I am expecting a top.
This is my go-to-chart, and I don't see anything here to suggest that there is pressure building for a big move lower coming for the stock market. This chart is bullish.

Disclaimer: I am not a registered investment advisor. My comments above reflect my view of the market, ...
more


Thanks for sharing