
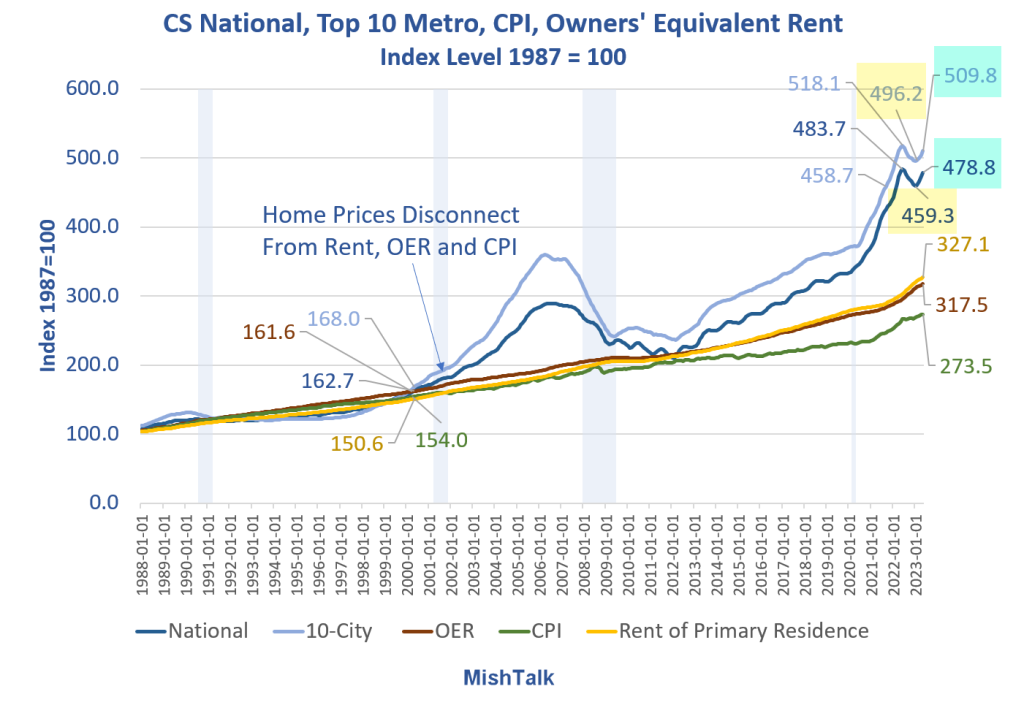
Case Shiller National and 10-City home prices indexes plus OER, CPI, and Rent indexes from the BLS.
Chart Notes
- The latest Case-Shiller home price indexes is for May. It represents repeat sales of the same house in roughly a March-April timeframe.
- OER stands for Owners’ Equivalent rent. It’s the price one would pay to rent one’s own home, unfurnished, without utilities.
- CPI is the consumer price index.
- Rent of primary resident is just what it sounds.
- CPI, OER, and Rent as as measured by the Bureau of Labor Statistics (BLS).
Home prices wildly disconnected from the CPI in 2000 and in 2013. The disconnect accelerated in 2020.
After a two-month decline in most markets, prices are again on the rise.
The Bubble Expands Again
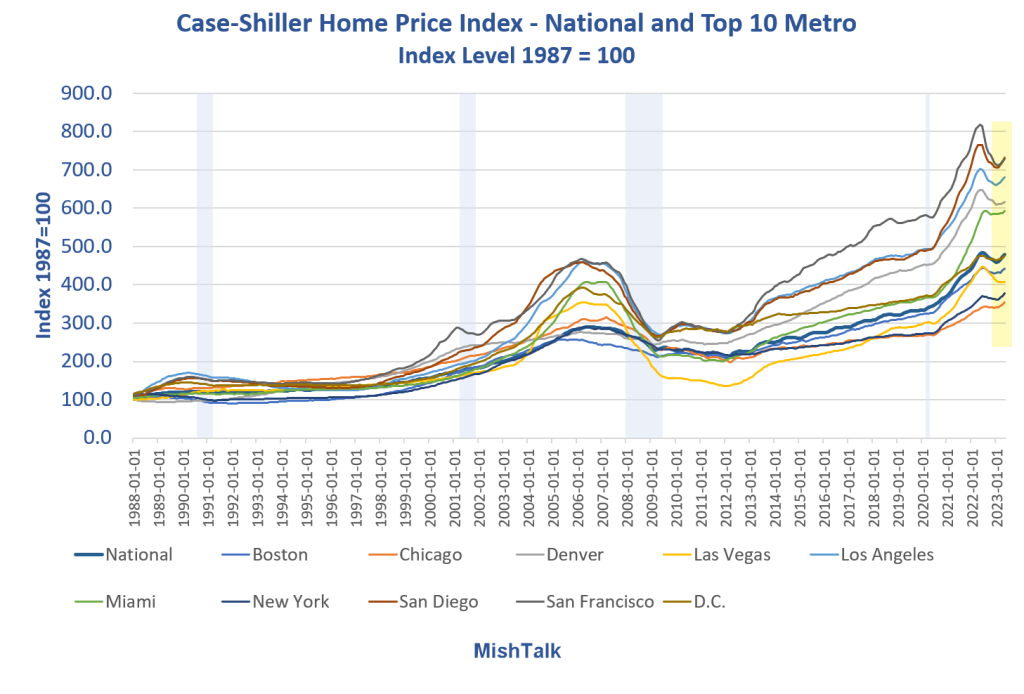
Home prices rose in May, from April, in every city in the 10-city list.
Case-Shiller Home Prices Percent Change Year-Over-Year

Case Shiller National and 10-City home prices indexes via the St. Louis Fed, chart and calculation by Mish.
Declining and Rising Cities Year-Over-Year
- Declining Cities: Denver, Las Vegas, Los Angeles, San Diego, San Francisco, D.C., plus the National and 10-City indexes. San Francisco and Las Vegas lead the way, down 11.14 percent and 7.80 percent respectively.
- Rising Cities: Boston, Chicago, Miami, and New York. Chicago and Miami lead the pack, up 4.56 percent and up 3.4 percent respectively.
Percent Decline From the National Peak

Case Shiller National and 10-City home prices indexes via the St. Louis Fed, chart and calculation by Mish.
Chicago, Miami, and New York all have prices higher than the national Case-Shiller index peak in June of 2022.
What’s Going On?
- There is a dearth of existing homes for sale thanks to Fed incompetence and as explained in the points below.
- The Fed lowered interest rates to nearly zero and mortgage rates fell below 3 percent. Existing homeowners refinanced at that rate.
- People do not want to trade a 3 percent mortgage for a 7 percent mortgage.
- Thanks to points one and two, sales have dried up.
- All cash buyers are not concerned about interest rates and that supports the price of homes that do sell.
Existing Home Sales Percent Change
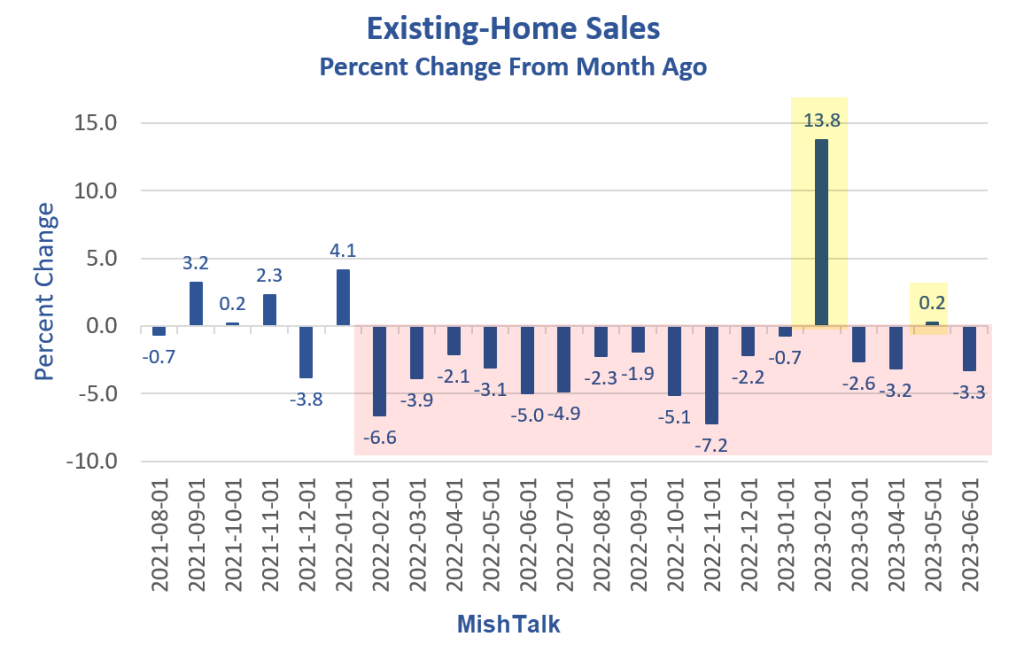
Existing-home sales data from the NAR via St. Louis Fed download.
Existing Home Sales Seasonally Adjusted
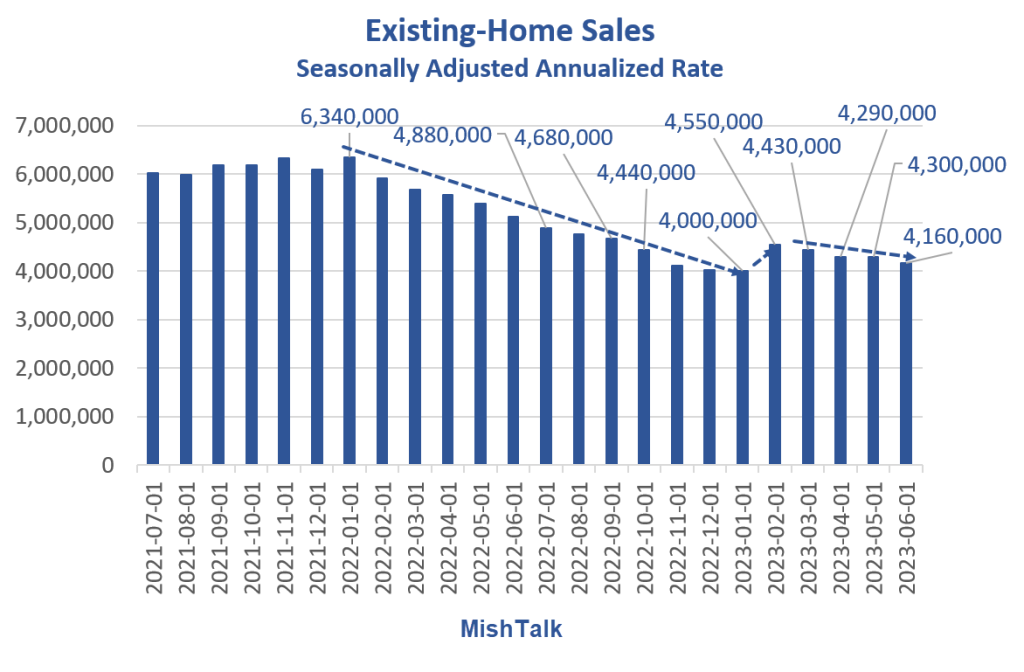
Transaction Crash
Existing home sales have crashed to a level seen in the mid 1990s. Prices have not crashed but transactions have.
People who want to move are effectively trapped in their houses because they do not want to trade a sub-3% mortgage for a 7.0% mortgage.
The bidding wars we do see are from people who are price insensitive. They make for amusing anecdotes but the above chart shows the real picture.
This crash is likely to last longer because intertest rates are likely to stay higher for longer because the Fed fears stoking more inflation.
Home sales mean appliance sales, new furniture, cabinets, new carpet, landscaping, etc. Who doesn’t spend a lot more money when they move into a new home?
Are Home Prices Really Rising?
The Case-Shiller data is so lagging and the Fed has so distorted the market it’s hard to say with any degree of confidence.
In the 2008 bubble, once bubbles popped, there was no hint of strength for two years.
Note the existing home sales bounce in February. Interest rates momentarily dropped which led to a brief surge in buying. Mortgage rates have since climbed back 7 percent or higher and have stayed there.
Prices are at their lowest level of affordably in decades and the economy is weakening. I believe the bounce is suspect and largely over if not totally over. There’s also a lag impact of the end of three rounds of fiscal stimulus and the start of student loan payments. Both should take a toll on spending.
Beware the Huge Negative Lag Impact of Three Rounds of Covid Stimulus
For discussion, please see Beware the Huge Negative Lag Impact of Three Rounds of Covid Stimulus
Also see Noose Tightens on Consumer Credit, Auto Loan Rejections Hit Record High
This economy is seriously on fumes, just as the typical economist has given up on recession.
More By This Author:
Beware The Huge Negative Lag Impact Of Three Rounds Of Covid Stimulus
Service Sector Growth Weakens In July, Sticky Inflation Persists
Noose Tightens On Consumer Credit, Auto Loan Rejections Hit Record High


Comments
Log in or sign up to join the conversation.