
The Great Slowdown

Image Source: Pexels
Economic news is increasingly hard to follow these days, mainly because it changes so fast and it gives so many mixed signals. Less than three months ago, we were all in shock from President Trump’s “Liberation Day” tariff announcement. While he paused the worst parts of that plan, US import taxes are still at their highest point in decades. Yet now the headlines are more about oil and geopolitics. It turns out that most of the news is just noise. The markets aren’t significantly different from where they were 90 days ago.
My first reaction to the Liberation Day tariffs was that we would have a hard time avoiding recession if the full plan actually went into effect. I wrote as much at the time in a letter titled The Tariff Recession?.
That headline had a question mark because I hoped to avoid the worst. Now it seems we have… though that could change. The 90-day negotiation period that Trump announced back in April ends soon. The only “deal” so far has been some small changes with the UK. Maybe others are coming. We’ll see.
But avoiding the worst doesn’t mean no problems at all. Even if Trump dials all the way back to pre-April trade policies (which I don’t expect), events over the last three months will have consequences.
I think (knocking on wood) we can avoid recession this year (assuming Trump doesn’t reinstate the high tariffs from 90 days ago). While the economy is slower for reasons I will explain below, it is still growing. Free markets are a beautiful thing, and the biggest headwinds for growth are actually caused by the government, mainly in the form of a growing mass of national debt and, to some extent, a confusing trade policy that is negatively distorting imports and exports. The outlook seems soft, but not what I would call “weak.”
I also think we can avoid significantly higher inflation than the current PCE 2.7% core rate.We’re headed toward something else—not a boom, not a recession, not severe inflation or deflation, but a period of slow, grinding growth that satisfies almost no one. Some call it stagflation, but I don’t think that’s accurate. I and some of my readers remember true stagflation from the late ‘70s and ‘80s: high inflation, high unemployment, and low growth.
Good things are happening, too. Innovation will continue in AI, biotechnology, new defense tech, and more. The next wave of the robotic revolution is still a few years away, but it will be powerful. Unemployment should stay relatively low. Hundreds of thousands of small businesses will be launched over the next few years. Existing businesses will adapt and figure out how to grow.
If this sounds like my trademark “muddle through” attitude, you’re right. But you need to understand why we’re in this position. There are a bunch of small reasons… and a really big one. Understanding it will give you a better handle on your own investments, businesses, and life.
Growth by Decade
Before we consider recent events, let’s look at the long-term picture for GDP growth. I have written before about the many flaws of Gross Domestic Product as a measure of economic growth. Nevertheless, it does give us a rough measure of how much the economy is growing (or not growing).
My friend Ed Easterling of Crestmont Research made this useful chart of GDP growth by decade. For 10-year calendar decades, annualized GDP growth was as low as 1% and approached 6% in the 1940s.
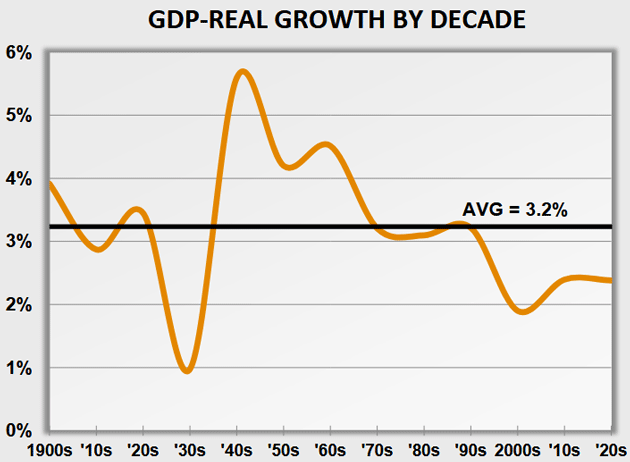
Source: Crestmont Research
That 1940s peak was the beginning of a long slide lower. Here are the numbers.
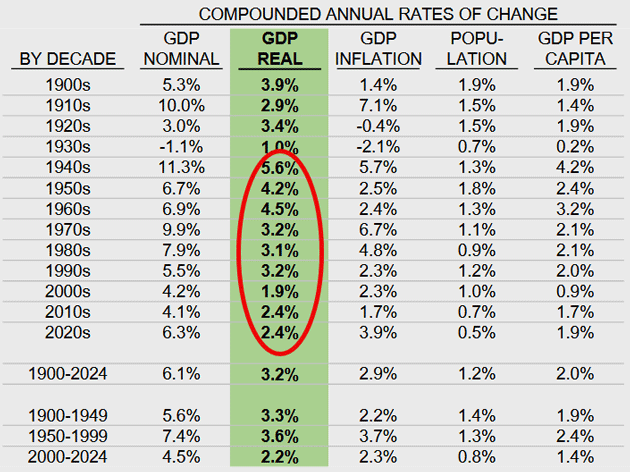
Source: Crestmont Research
For six consecutive decades from the 1940s to the 1990s, average GDP growth was always 3.1% or higher. Sometimes better, sometimes worse, but that was the average. Key word “was”.
Those 3% years still happen—we had one in 2023—but they’ve been unusual since 2000. Average growth in this century through 2024 has been only 2.2%. That’s far below the 1950–1999 postwar pace of 3.6%. While that seems a small difference, after a little over 50 years, that is literally the difference between having an economy twice the size.
This is even more true if you look at GDP growth on a per capita basis, which is the way we as individuals actually experience it. The 1950–1999 average was 2.4%. Since then? Only 1.4%. Remember that GDP equals the number of workers times productivity. We have been adding workers, so that makes the absolute nominal number of the GDP up for the country, BUT the actual growth we feel individually is less.
This is a “your mileage may vary” type of situation. I imagine that most of my readers have seen their personal GDP go up more than 1.4%. You can look at the income statistics and find out that those in higher income brackets with more education, etc., do better than those in lower income brackets with less education. Factoring in inflation, a significant number haven’t seen much change in their economic situation. It is not a crisis per se, but it sure doesn’t feel good.
As Martin Gurri writes in his powerful book, The Revolt of the Public, there was a time when those in lower income brackets weren’t continually confronted with their relative differences from those who were prospering. With the information revolution and social media, it’s now in their faces every day.
More By This Author:
The Investment Signal In The Noise
Good News And Creative Destruction
Bullish Highlights


