
Key Takeaway
As of now, there are not too many reasons as to why you should not to be invested in the US Equity Markets; however, when things are going so smoothly, it may be time to begin looking for opposing underlying currents. One which we've identified is the money flow levels into Money Market funds. Certainly it could be simply a function of acceptable levels of "risk-free" returns, or is it a prelude to something bigger?? In the chart below, you'll see historical levels of money market funds relative to US Recessions (grey bars).
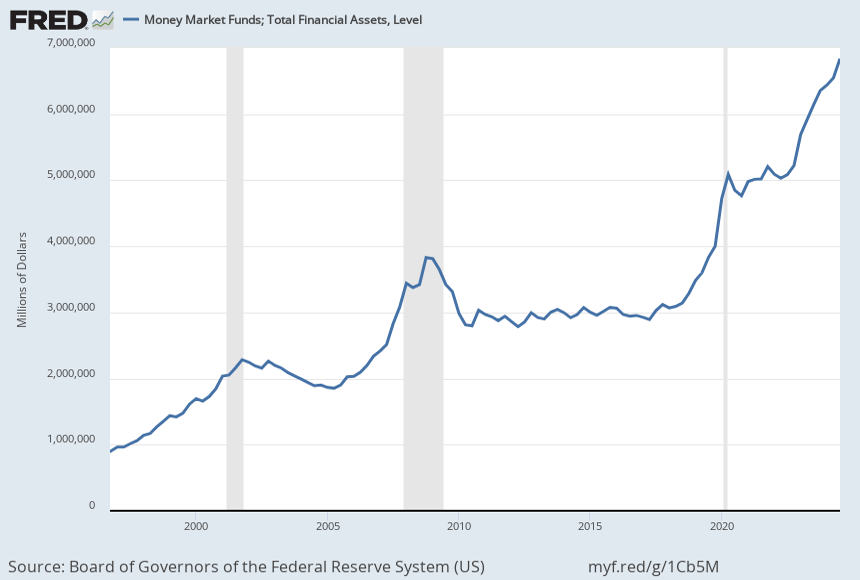
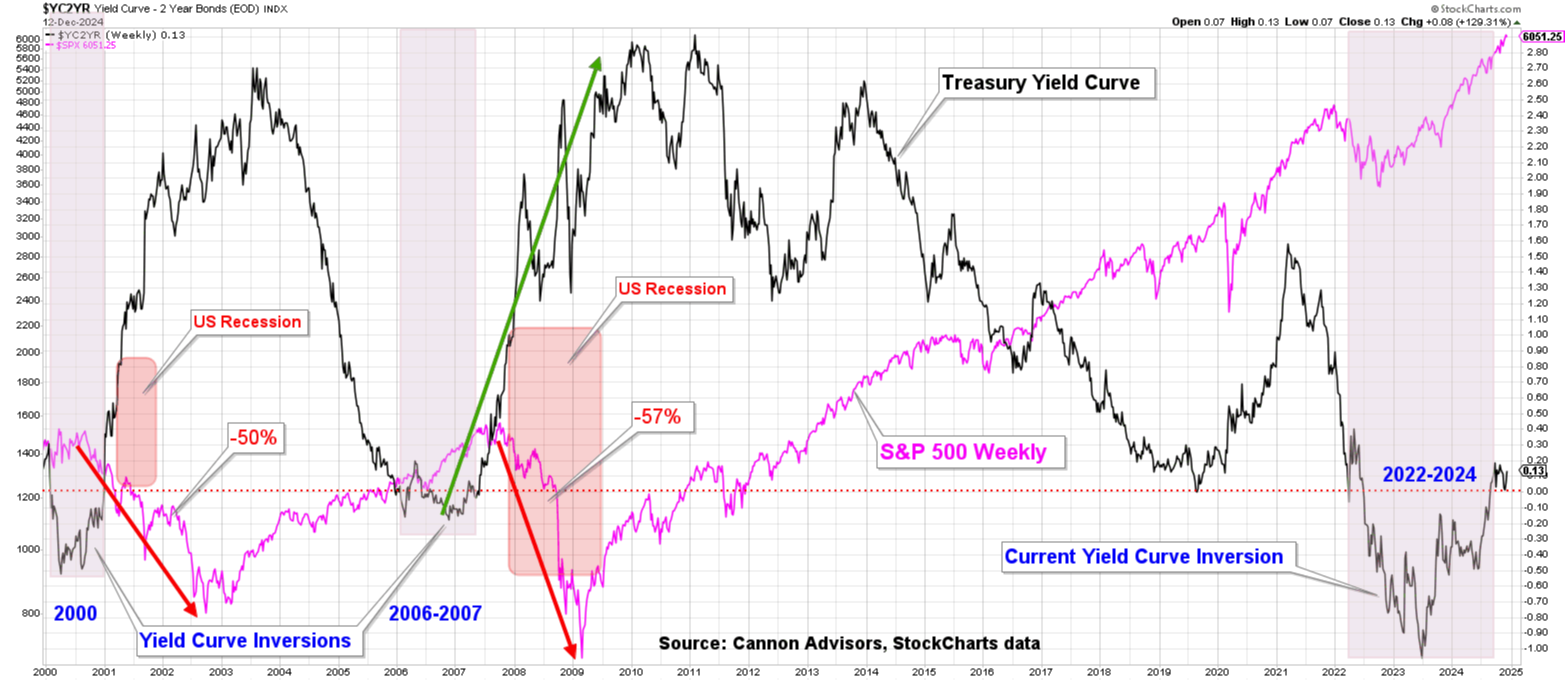
As you can see, the levels of Money Market investments rise prior to a recession. Keep in mind though that historically we generally experience a Yield Curve Inversion prior to a recession - meaning rates rise to fight inflation or a run-away market and folks make good returns on their cash. So maybe it's just a function of getting good returns with far less volatility, or maybe it's a sign of difficult times ahead - time will tell. Below is a chart illustrating the Yield Curve relative to both recessions as well as the S&P 500. Recently the Yield Curve just "normalized" or turned positive. I'm not calling for a stock market correction by any means (yet anyway), but it's important to take note of more than just the stock market levels, one of which is the great cash hoard.
More By This Author:
Market Pull Back - Caution?The January Effect
Stock Market Technical Analysis: Dos and Don'ts

Comments
Log in or sign up to join the conversation.