

Image Source: Unsplash
On a lazy afternoon, a person’s thoughts naturally turn to car price indexes. There actually is a reason that I became interested in this topic. I noticed that in the January Consumer Price Index, the new vehicle index rose 0.2%. The December measure was revised up due to new seasonal adjustment factors, so what had been reported as a 0.1% decline last month is now reported as a 0.6% increase.
I was inclined to think this was an aberration, that we would see the downward trend that had previously been apparent in the data would reappear in another month or two. However, I noticed that the Manheim index for used vehicle prices showed a sharp uptick for January and the first half of February.
This was after a full year in which declining prices were reversing much of the pandemic run-up. Perhaps my expectation that vehicle prices, both new and used, would soon look like they were back on their pre-pandemic path was wrong.
Vehicle prices are a big deal in the CPI. Together, the new and used vehicle components comprise just under 7.0% of the overall index, and 8.8% of the core index. As a result, it will have a big impact on our inflation measures if vehicle prices are on a downward path, as it seemed when we got the December CPI.
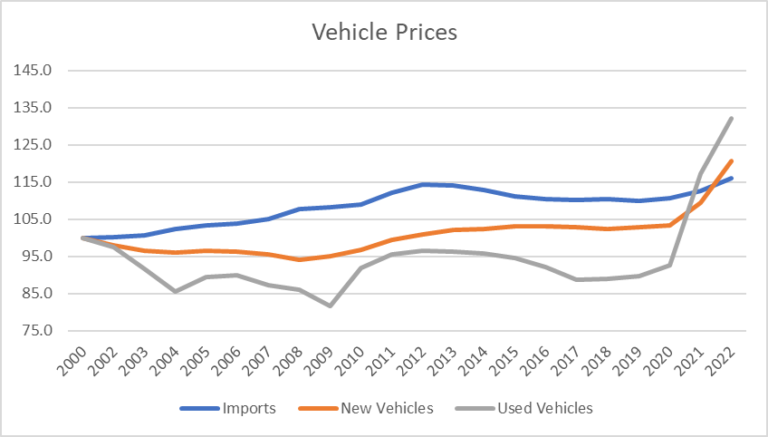
I thought I would look at a bit of history and pull in the index for imported vehicles. (This is not entirely apples to apples, since the import index includes car parts). Here’s the picture.
Source: Bureau of Labor Statistics.
As can be seen, the price index for imported vehicles somewhat outpaced the new vehicle index for the U.S. in the two decades prior to the pandemic. Currency values explain at least part of this movement. The dollar fell in value against the currencies of our trading partners from 2000 to 2012. It then began to rise modestly, which is the period when saw the gap close slightly.
Still, by 2019, there was still a gap of roughly 7.0 percentage points, with the import price index rising by 9.8 percentage points since 2000, compared to an increase of just 2.8% in the new vehicle price index.
There was a larger gap between the new vehicle price index and the used vehicle price index. The used vehicle price index was actually 10.3% below its 2000 value in 2019, implying a gap of 13.1 percentage points between the new and used vehicle indexes over this 19-year period.
This story gets completely reversed in the years since the pandemic. Used vehicle prices are up by 37.2%, new vehicle prices are up by 20.1%, while the index for imported vehicles has increased by just 6.9%. This raises the question of whether there is some fundamental factor that has led to a lasting change in the pattern of new, used, and imported vehicles, or whether this is a temporary story which will revert back to the pre-pandemic path in time.
Offhand, I can’t see any fundamental factor that has changed in a way that would affect these price trends. The dollar did rise in 2021 and earlier in 2022, which would lower imported car prices in the United States, but it is now pretty much back to its pre-pandemic level against most currencies, so currency valuations can’t explain much of the picture.
And, currency values won’t tell us anything about the far more rapid rise in used vehicle prices than new vehicle prices. This is easily explained in the context of pandemic shortages of cars, driving up used cars prices, but if we envision a post-pandemic future where automakers can produce enough vehicles to meet demand, presumably we will see the former pattern restored.
There may well be something that I am missing (suggestions are welcome), but it still looks to me like we should expect the new vehicle index to converge towards the imported vehicle index, and the used vehicle index to again drop below the new vehicle index. This path may take longer than I had expected, but it still seems likely.
That means that we should expect vehicle prices to be constraining inflation going forward. That may not be the case in the next couple of months, but is likely to be true later in 2023 and into 2024.
More By This Author:
The $119 Billion Spent On Food Stamps Last Year Was 1.9 Percent Of Federal Spending, But You All Knew That, Right?That 3.0 Percent Jump In Retail Sales In January Is Not A Big Deal
The Fed’s 2.0 Percent Inflation Target


Comments
Log in or sign up to join the conversation.